CAC Payback for SaaS: Calculate, Benchmark, and Improve
Discover how to calculate and optimize CAC payback for your SaaS business. Shortening payback can drive growth and boost cash flow.

CAC Payback for SaaS: Calculate, Benchmark, and Improve
CAC payback is the number of months it takes for a customer’s gross profit to cover the fully loaded cost of acquiring them. The core formula: CAC ÷ (ARPA × gross margin %) gives you monthly gross profit per customer, and dividing CAC by that figure tells you exactly how long you’re underwater. For most SaaS businesses, under 6 months is exceptional, 6–12 months is healthy and fundable, 12–18 months is extended but manageable with strong retention, and anything above 18 months starts locking up capital in ways that constrain growth.
Key Takeaways
CAC payback is the single most direct measure of capital efficiency in SaaS: the formula is CAC ÷ (ARPA × gross margin %), and the result tells you exactly how long each new customer keeps your cash tied up before it recycles.
| Point | Details |
|---|---|
| Core formula | CAC ÷ (ARPA × gross margin %) gives payback in months; use churn-adjusted version when monthly churn exceeds 1–2%. |
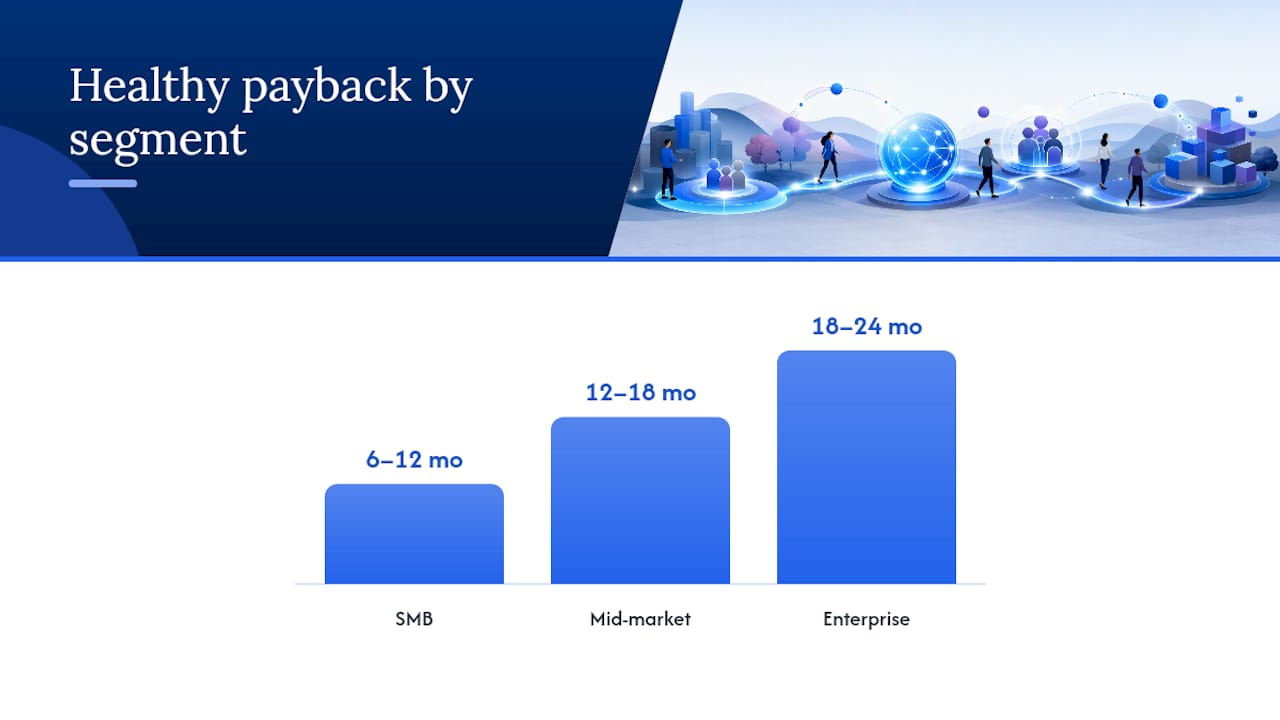
| Segment benchmarks | SMB targets under 12 months; mid-market under 18 months; enterprise under 24 months per Revenue Map’s stage-based guidance. |
| Top improvement lever | Gross margin improvements compound permanently across all future acquisitions, making them the highest-impact payback lever. |
| Pair with LTV | Payback alone doesn’t confirm a good deal; always pair it with LTV and LTV:CAC to track short-term cash and long-run profitability together. |
| Getpaidlens | Getpaidlens ranks channel-level reallocation recommendations by expected impact and confidence, helping teams reduce wasted CAC and compress payback faster. |
Table of Contents
- Why CAC payback matters for SaaS finance and growth
- How to calculate CAC payback: formulas, inputs, and the churn-adjusted variant
- Worked examples and vetted calculators to run your own numbers
- What do your payback numbers actually mean? Benchmarks by segment and stage
- Common pitfalls and calculation variants that change your result
- Practical levers to shorten CAC payback, ranked by impact
- How decision intelligence for performance marketing speeds CAC payback
- A practitioner’s view on using payback in real planning decisions
- Getpaidlens gives performance marketing teams a faster path to payback improvement
- Sources
- FAQ
Why CAC payback matters for SaaS finance and growth
Payback isn’t just a metric you report to investors. It’s a cash-flow clock. Every month a customer hasn’t paid back their acquisition cost, that capital is tied up and unavailable for the next hire, the next campaign, or the next product bet. Shorter payback means faster capital recycling, which means you can grow without burning through reserves or raising at unfavorable terms.
The metric works alongside LTV and the LTV:CAC ratio, not instead of them. LTV tells you the long-run value of a customer relationship. Payback tells you how long you’re exposed before you break even on that relationship. A company with a 5:1 LTV:CAC ratio but a 24-month payback period still has a cash-flow problem if it’s growing fast, because it’s constantly funding new acquisitions before old ones have paid off. Stripe’s resource on CAC payback makes this point directly: pair payback with LTV when evaluating GTM efficiency, because neither number alone tells the full story.
Four operational consequences that follow directly from payback length:
- Budget pacing: Long payback forces conservative spend caps; short payback justifies aggressive reinvestment.
- Hiring cadence: Sales and CS headcount decisions depend on how quickly new customers become cash-flow positive.
- Scaling signals: A payback trending shorter quarter-over-quarter is a green light to scale acquisition; trending longer is a warning to fix unit economics first.
- Fundraising leverage: Investors use payback as a proxy for capital efficiency. Revenue Map’s benchmark analysis notes that shorter payback directly reduces capital lock-up and expands growth capacity, which is exactly what growth-stage investors want to see.
Industry context: Operators and investors commonly use payback as a leading indicator of capital efficiency. A payback period trending downward, even by a few months, signals improving GTM leverage before it shows up in ARR growth.
How to calculate CAC payback: formulas, inputs, and the churn-adjusted variant
Inputs you need to collect
Before running any formula, gather these numbers for the same cohort and time window:
- Fully loaded CAC: total marketing spend + sales salaries and commissions + onboarding costs, divided by new customers acquired in the period.
- ARPA (Average Revenue Per Account): new MRR or ACV per customer at the point of acquisition, not blended across the whole base.
- Gross margin %: revenue minus COGS (hosting, support, infrastructure), expressed as a percentage. Do not use revenue alone.
- Support cost per customer per month: if not already embedded in COGS, add it.
- Monthly churn rate: the percentage of customers lost each month, used in the churn-adjusted formula.
- Onboarding cost per customer: one-time cost; include it in CAC if not already there.
The simple payback formula
CAC ÷ (New MRR per customer × Gross margin %) = Payback in months
CFI’s payback period guide presents this as the standard gross-margin-adjusted formula and explicitly warns against using revenue instead of gross profit, which overstates recovery speed.
If you’re working from ARR figures, convert first: divide ACV by 12 to get monthly gross profit before applying the margin. Express the result in months.
The churn-adjusted payback formula
The churn-adjusted version accounts for the fact that some customers leave before paying back their CAC:
CAC ÷ (Monthly gross profit per customer × (1 − monthly churn rate)) = Churn-adjusted payback
The TheCalcs CAC payback calculator implements this formula directly and shows the difference between simple and churn-adjusted results side by side. In their default worked example, simple payback comes out at approximately 9.55 months and churn-adjusted at 10 months — a modest gap at low churn, but one that widens sharply as churn climbs.
| Input | Simple formula | Churn-adjusted formula |
|---|---|---|
| CAC | Required | Required |
| Monthly gross profit per customer | Required | Required |
| Monthly churn rate | Not used | Required |
| Output | Months to break even (no attrition) | Months to break even (with attrition) |
Pro Tip: Use cohort-level CAC, not blended CAC, whenever you can. Blended CAC averages across all channels and hides the fact that, say, your paid social cohort might have a 20-month payback while your organic cohort sits at 8 months. TheSaaSCFO’s walkthrough describes exactly this problem: blended CAC masks channel differences that matter for allocation decisions.
One practical note on measurement windows: the spend and the acquisitions you use must come from the same period. Using Q1 spend against Q2 acquisitions (common when there’s a sales lag) inflates CAC artificially. Align the window, then calculate.
Worked examples and vetted calculators to run your own numbers
Example A: Low-touch SMB
A SaaS company sells a project management tool at $80/month ARPA.
Simple payback: $600 ÷ $60 = 10 months
Churn-adjusted payback: $600 ÷ ($60 × (1 − 0.015)) = $600 ÷ $59.10 = ~10.2 months
This cohort sits in the healthy-to-extended range for SMB.
Example B: High-touch enterprise
A B2B platform closes enterprise deals at $2,500/month ACV. Fully loaded CAC including SDR time, AE commission, and onboarding is $28,000.
Simple payback: $28,000 ÷ $1,750 = 16 months
Churn-adjusted payback: $28,000 ÷ ($1,750 × (1 − 0.005)) = $28,000 ÷ $1,741.25 = ~16.1 months
Enterprise customers churn less, so the simple formula is usually sufficient. The 16-month result is within the acceptable range for enterprise SaaS, especially when expansion revenue is factored in.
For running your own numbers, three calculators worth bookmarking:
- TheCalcs payback calculator: best for quick blended-CAC and churn-adjusted calculations with a clean UI.
- Stripe’s CAC payback resource: useful for conceptual grounding alongside the formula.
- TheSaaSCFO walkthrough: practitioner-level detail on inputs and cohort-level measurement choices.
Below that threshold, the simple formula is close enough for planning.
What do your payback numbers actually mean? Benchmarks by segment and stage
A single industry median for payback is nearly useless without knowing the customer segment. A 14-month payback for an SMB-focused product is a problem. Revenue Map’s segment benchmarks break it down by stage:
| Segment | Best-in-class | Healthy | Extended | High-risk |
|---|---|---|---|---|
| SMB | <6 months | 6–12 months | 12–18 months | >18 months |
| Mid-market | <12 months | 12–18 months | 18–24 months | >24 months |
| Enterprise | <18 months | 18–24 months | 24–30 months | >30 months |
Enterprise tolerates longer payback for two structural reasons: expansion revenue ramps ACV over time, and churn is lower, so the cohort stays intact long enough to recover the investment. SMB needs faster payback because churn is higher and ARPA is lower, meaning there’s less margin for error.
What each band implies for decisions:
A best-in-class result means you can scale acquisition aggressively. Capital recycles fast enough to fund growth without external financing. A healthy result supports steady scaling with normal fundraising. Extended payback calls for tighter spend controls and a clear plan to improve one or more of the key inputs. High-risk payback means the unit economics need fixing before you scale, because every new customer you acquire makes the cash-flow problem larger.
Month-over-month improvement in payback matters to investors even before you hit a benchmark band. A company moving from 22 months to 18 months over two quarters is telling a better story than one sitting at a flat 14 months.
Always compare payback within your own segment and ACV range. Benchmarking your enterprise product against SMB medians will make your numbers look worse than they are, and vice versa.
Common pitfalls and calculation variants that change your result
The most frequent mistake is using revenue instead of gross profit in the denominator. A product that looks like it pays back in 10 months on a revenue basis actually takes about 15 months on a gross-profit basis. CFI’s formula guidance is explicit on this: always use gross-margin-adjusted payback, not revenue-based payback.
Other pitfalls that produce misleading results:
- Excluding onboarding and support costs from CAC. If your CS team spends 40 hours onboarding each enterprise customer, that cost belongs in CAC. Leaving it out makes payback look shorter than it is.
- Mismatched time windows. Using January spend against February acquisitions inflates CAC. Use the same period for both.
- Blending heterogeneous channels. Averaging paid search (low churn, high intent) with display retargeting (higher churn, lower intent) hides which channels are actually profitable.
Metric variants you’ll encounter:
- Simple (revenue-based) payback: CAC ÷ monthly ARPA. Fast to calculate, but overstates recovery speed.
- Gross-margin-adjusted payback: CAC ÷ (ARPA × gross margin %). The standard.
- Churn-adjusted payback: CAC ÷ (monthly gross profit × (1 − churn)). Use this for cohorts with measurable attrition.
- Cohort payback: calculated separately for each acquisition cohort, by channel or period. The most accurate for allocation decisions.
- Dollar-based payback: uses net revenue retention instead of simple churn, useful for expansion-heavy models where NRR exceeds 100%.
Pro Tip: Align your contract start date, activation date, and measurement window. If you start the payback clock at contract signature but the customer doesn’t activate for 30 days, you’re adding a phantom month to every cohort’s payback. Start the clock at activation, not signature.
One caveat worth noting: payback ignores the time value of money. A dollar recovered in month 3 is worth more than a dollar recovered in month 18. For most SaaS planning purposes this doesn’t change decisions materially, but in long-cycle enterprise models it’s worth acknowledging.
Practical levers to shorten CAC payback, ranked by impact
1. Improve gross margin
A 5-point margin improvement reduces payback on every future acquisition permanently. Margin improvements compound because they apply to the entire acquisition base going forward. Levers include pricing discipline, infrastructure cost reduction, and packaging changes that shift customers to higher-margin tiers.
2. Raise ARPA or ACV
Higher revenue per customer shrinks payback directly. Upsell motions, bundling, and usage-based pricing that ramps with adoption all lift ARPA over time. For expansion-heavy models, track dollar-based payback alongside simple payback to capture the full effect.
3. Reduce CAC
Channel optimization, conversion rate improvements, and referral programs all reduce the numerator. A/B testing landing pages, tightening ICP targeting, and shifting budget toward lower-CAC channels (organic, partner, self-serve) can move CAC meaningfully within a quarter. Tools like Selloop illustrate how AI-driven channel optimization can reduce wasted spend in paid acquisition, which directly compresses CAC.
4. Reduce time-to-value and onboarding friction
Faster activation means customers start generating gross profit sooner. Every week you shave off the onboarding cycle is a week off effective payback. Track time-to-first-value as a leading indicator of retention, not just a product metric.

5. Reduce churn and accelerate expansion
Lower churn makes the churn-adjusted payback converge toward the simple payback. Expansion revenue from upsells and seat growth can push effective payback below the simple formula’s result. Both levers improve the denominator without touching CAC.
6. Shift channel mix toward lower-CAC channels
Scaling self-serve funnels, content-led acquisition, and product-led growth reduces blended CAC over time. Segmenting payback by channel, as TheSaaSCFO recommends, reveals which channels are dragging the average up and which deserve more budget.
Pro Tip: Measure CAC by cohort and channel simultaneously. A channel that looks expensive on blended CAC might have the shortest payback because its customers churn less and expand more. The allocation decision belongs at the cohort level, not the aggregate.
How decision intelligence for performance marketing speeds CAC payback
The bottleneck in most payback improvement efforts isn’t knowing which levers exist. It’s detecting which channels are underperforming fast enough to act before the next cohort is already acquired at the wrong cost.
A decision-intelligence workflow changes that sequence. Instead of reviewing dashboards manually, the system detects a poor-performing channel, scores the expected impact of a reallocation against historical patterns, and surfaces a ranked recommendation with a confidence score. The marketing team acts on the highest-confidence move first, reallocates budget, and measures the payback improvement for the next cohort. The cycle compresses from weeks to days.

Accurate attribution is a prerequisite. If your channel-level CAC is built on misattributed conversions, reallocations based on that data will move budget toward the wrong channels. Clean, validated marketing data connections are what make the payback improvement cycle reliable rather than directional.
Results depend on data quality, correct attribution setup, and proper experiment design. Decision intelligence amplifies good measurement; it doesn’t fix bad measurement.
A practitioner’s view on using payback in real planning decisions
Payback is a planning constraint, not a target to minimize at all costs. Accepting a slightly longer payback period is often the right call when LTV and expansion revenue validate the investment.
The scenario where payback should change a decision: you’re deciding whether to hire two more AEs or double your paid acquisition budget. If your current payback is already 18 months and your runway is 14 months, scaling either lever makes the cash-flow problem worse before it gets better. Fix the denominator first — margin or ARPA — then scale the numerator.
On reporting cadence: track blended payback monthly as a trend line. Track cohort-level payback by channel quarterly, when you have enough data for statistical stability. Weekly, watch time-to-first-value and activation rates as leading indicators. The weekly numbers tell you where payback is heading before the monthly cohort data confirms it.
Getpaidlens gives performance marketing teams a faster path to payback improvement
Performance marketing teams that want to compress CAC payback need two things: reliable attribution data and a prioritized list of where to act next. Getpaidlens delivers both. It connects your ad platforms, CRM, and revenue data, validates data quality across sources, and produces a ranked queue of recommendations tied to expected business impact and confidence scores, so your team acts on the highest-leverage moves first rather than the loudest ones.
Where most teams spend days pulling channel-level CAC reports, Getpaidlens surfaces the same insight in the daily recommendation feed, with the evidence behind each suggestion visible and auditable. The attribution feature is built specifically for teams that need to trust their payback inputs before they act on them. If your CAC numbers are built on shaky attribution, every reallocation decision is a guess. Start with clean data, then let the ranked recommendations tell you where to move budget. Check the attribution feature or explore pricing to see which plan fits your team’s scale.
Sources
- CAC Payback Calculator | Customer Acquisition Payback Period
- CAC Payback Period: How to Calculate and Benchmark It | CFI
- CAC Payback Period: How to Calculate and Benchmark It | Revenue Map
- How I Calculate the CAC Payback Period
Use the churn-adjusted mode whenever it’s available, and prefer gross-margin-adjusted formulas over revenue-based ones in every scenario.
This article is general information, not a substitute for advice from a qualified financial advisor. Consult a qualified financial professional about your own circumstances before acting on anything here.
FAQ
What is a good CAC payback period for SaaS?
Under 12 months is healthy for SMB SaaS, under 18 months for mid-market, and under 24 months for enterprise, per segment-based benchmarks. Best-in-class SMB products hit under 6 months.
What does CAC mean in finance?
CAC stands for customer acquisition cost: the fully loaded cost of acquiring one new customer, including marketing spend, sales salaries and commissions, and onboarding expenses.
How do you calculate CAC payback?
Divide fully loaded CAC by monthly gross profit per customer (ARPA × gross margin %). For cohorts with measurable churn, use the churn-adjusted version: CAC ÷ (monthly gross profit × (1 − monthly churn rate)).
Why should I use gross margin instead of revenue in the formula?
Revenue-based payback overstates recovery speed because it ignores your cost of delivering the service.
How does CAC payback relate to LTV:CAC ratio?
Payback measures short-term cash recovery; LTV:CAC measures long-run profitability. A strong LTV:CAC ratio with a long payback period still creates a cash-flow constraint if you’re growing fast. Track both together for a complete picture of unit economics.