Marketing Data Warehouse: A Marketer's 90-Day Plan
Unlock your marketing potential with a 90-day plan for building a data warehouse. Streamline reporting and enhance performance today!

Marketing Data Warehouse: A Marketer’s 90-Day Plan
A marketing data warehouse is a centralized analytical store that pulls data from every ad platform, CRM, email tool, and analytics source you use, then holds it in a structured form built for reporting, attribution, and modeling. If your team is stitching together cross-channel performance in spreadsheets, waiting hours for a report that should take minutes, or arguing over which dashboard shows the “real” ROAS, a warehouse is the fix.
Here is what to do first:
- Confirm the threshold. According to MarketerHire’s research, most marketing teams hit the inflection point around several active tools or when manual reporting consumes a significant number of hours per week. If you are past that, the ROI case is already there.
- Pick your warehouse and connect your top three sources. Start with your CRM, primary ad platforms, and web analytics. Everything else can follow in weeks two through four.
- Follow the 90-day pattern. Days 1–30: foundations. Days 31–60: modeling and validation. Days 61–90: activation and dashboards. This practical build plan from Pedowitz Group is the closest thing to a standard implementation timeline the industry has settled on.
The two biggest ROI drivers are analyst time saved (fewer ad hoc pulls, fewer conflicting reports) and attribution clarity (knowing which channels actually drive revenue, not just last-click credit).
Key Takeaways
A marketing data warehouse pays back fastest when your team runs multiple active tools or spends substantial time per week on manual reporting.
| Point | Details |
|---|---|
| Warehouse inflection point | Invest when you run several active tools or spend significant time per week on manual reporting. |
| Recommended starter stack | BigQuery + Airbyte + dbt Core + Looker Studio covers most teams under $2M in ad spend. |
| 90-day milestones | Foundations by day 30, core marts live by day 60, activation and exec dashboard by day 90. |
| Activation via reverse ETL | Push consented, hashed conversions and LTV-derived audiences back to ad platforms to improve match rates and bid efficiency. |
| Getpaidlens | Layers AI-ranked recommendations and a natural-language analyst on top of warehouse outputs to cut time from insight to action. |
Table of Contents
- What a marketing data warehouse does for your team every day
- How a warehouse differs from a CDP, data lake, and data mart
- Business outcomes marketing teams get from a warehouse
- Key components and architecture: what the layers actually do
- Common tools and recommended modern stacks for marketing teams
- How to choose the right warehouse and tools for your marketing team
- A practical 90-day implementation plan
- What it costs and the main cost drivers
- Common challenges and how to avoid them
- How to activate warehouse outputs: reverse ETL and practical patterns
- Quick-start checklist: what to connect first and the first five reports to ship
- The warehouse is a long-term bet, not a quick fix
- Getpaidlens layers AI decision intelligence on top of your warehouse data
- Sources
- FAQ
What a marketing data warehouse does for your team every day
A marketing data warehouse is not a generic database. A generic database is built for transactional writes and reads, optimized for speed on individual records. A warehouse is built for analytical queries across millions of rows, optimized for aggregation, joins, and historical comparisons. That distinction matters in practice because marketing questions are almost always analytical: “What was our blended CAC by channel last quarter?” or “Which cohort retained best after the Q3 campaign?”
Day-to-day, the warehouse ingests data from sources like:
- Ad platforms: Google Ads, Meta, LinkedIn, TikTok, Pinterest
- CRM and revenue: Salesforce, HubSpot, Stripe, or your billing system
- Web and product analytics: Google Analytics, Amplitude, Mixpanel
- Email and lifecycle tools: Klaviyo, Braze, Mailchimp
- E-commerce: Shopify, BigCommerce
Once those sources land in the warehouse, analysts can run attribution models, cohort retention analysis, lifetime value calculations, and cross-channel spend efficiency reports without touching a spreadsheet.
On latency: most marketing warehouses run on batch schedules, typically hourly or daily. That is fine for attribution, LTV, and budget pacing. Real-time activation, like suppressing a customer from an ad audience the moment they convert, requires a customer data platform (CDP) or a reverse ETL layer on top of the warehouse. The warehouse handles the analysis; the CDP handles the millisecond-level profile updates.
How a warehouse differs from a CDP, data lake, and data mart
These four terms get used interchangeably in vendor decks, and they should not. Each solves a different problem.
| System | Primary purpose | Latency | Identity resolution | Activation | Primary users |
|---|---|---|---|---|---|
| Data warehouse | Historical analysis, reporting, modeling | Batch (hourly/daily) | Deterministic, batch | Via reverse ETL | Analysts, data engineers |
| CDP | Real-time profile unification, activation | Real-time or near-real-time | Deterministic + probabilistic | Native (ad platforms, email) | Marketing ops, CRM teams |
| Data lake | Raw storage, ML, exploration | Variable | Minimal (raw files) | Requires transformation | Data engineers, data scientists |
| Data mart | Focused subject-area reporting | Batch | Inherited from warehouse | Via BI tools | Business users, specific teams |
As Cdp, a marketing data warehouse is built for historical analysis and reporting, while a CDP is built for real-time profile unification and activation. They are complementary, not competing.
When to pair them: If you need both deep attribution modeling and real-time audience suppression, run a warehouse for analysis and a CDP for activation. The warehouse feeds the CDP with scored segments via reverse ETL.
When a lakehouse makes sense: Teams with large-scale ML needs (propensity models, recommendation engines) often land on a lakehouse architecture like Databricks, which combines raw storage with warehouse-grade query performance. For most marketing teams under $50M in ad spend, a standard warehouse plus dbt is sufficient.
Decision signals:
- Use a CDP when your primary need is real-time personalization or cross-channel profile resolution at the point of activation.
- Use a warehouse when your primary need is attribution, LTV modeling, cohort analysis, or executive reporting.
- Use a data mart when a specific team (say, paid social) needs a fast, pre-aggregated view without touching the full warehouse.
Business outcomes marketing teams get from a warehouse
The clearest benefit is a single source of truth for spend, conversions, and revenue. When every platform reports its own conversions using its own attribution window, you end up with total attributed revenue that exceeds actual revenue. A warehouse lets you apply a consistent attribution model across all channels simultaneously, using your actual revenue data from Salesforce or Stripe as the ground truth.
Other concrete outcomes:
- Faster budget decisions. Cross-channel ROAS comparisons that used to take a day of analyst work run in minutes. Teams that ship this report first typically reallocate 10–20% of budget within the first month.
- Reduced dashboard sprawl. Fewer conflicting numbers from platform-native dashboards means fewer arguments in weekly reviews and more time spent on decisions.
- Modeled outputs for activation. Once you have LTV by acquisition channel or propensity-to-churn scores in the warehouse, you can push those segments back to ad platforms via reverse ETL to improve bid optimization and audience targeting.
- Attribution you can audit. Unlike black-box platform attribution, warehouse-based models are transparent. You can inspect every touchpoint, change the lookback window, and explain the logic to a CFO.
The inflection point is real: MarketerHire’s research puts it at 8–12 active tools or 10+ hours per week of manual reporting. Past that threshold, the warehouse typically pays back in analyst time alone within the first quarter.
Key components and architecture: what the layers actually do
A well-designed marketing warehouse has five layers. Understanding them helps you assign ownership and avoid the most common failure mode: dumping raw data into a warehouse and calling it done.
| Layer | What it contains | Who owns it |
|---|---|---|
| Staging (raw) | Exact copies of source tables, no transformations | Data engineering |
| Core (resolved) | Identity-stitched, sessionized, deduplicated records | Analytics engineering |
| Marts (business-facing) | Pre-aggregated tables shaped for specific reports | Analytics engineering + marketing ops |
| Governance | Data contracts, freshness SLAs, lineage, access controls | Data engineering + legal |
| BI/serving layer | Dashboards, self-serve queries, exports | Analysts + marketing teams |
As Empire325 outlines, staging stores raw source tables exactly as they arrive; core resolves identity and sessionization; marts are business-facing tables shaped for reports and activation. That three-tier pattern inside the warehouse is where most of the modeling work happens.
Why ELT beats ETL for marketing data: In an ELT approach, you land raw data in the warehouse first, then transform it using SQL (typically with dbt). This preserves the original data for debugging, makes schema changes easier to handle, and lets you rerun transformations without re-ingesting from source. Traditional ETL transforms data before it lands, which means you lose the raw record and have to re-pull from the API if something breaks.
Identity stitching as a first-class object: Marketing data arrives with multiple identifiers: email addresses, anonymous cookie IDs, device IDs, CRM contact IDs. The core layer is where you resolve these into a single customer record. Design deterministic matching first (exact email match, exact phone match) before layering probabilistic logic. Store consent flags alongside the resolved identity so you know which records can be used for activation.
Schema patterns that work for marketing: A star schema with granular fact tables is the standard. Your fact table holds touchpoints or conversions at the lowest useful grain (one row per ad impression, one row per conversion event). Dimension tables hold campaigns, channels, time, and customer attributes. This structure makes attribution queries fast and flexible.
- Fact tables:
fct_ad_spend,fct_conversions,fct_sessions - Dimension tables:
dim_campaign,dim_channel,dim_customer,dim_date - Marts:
mart_channel_roas,mart_ltv_by_channel,mart_cohort_retention
Common tools and recommended modern stacks for marketing teams
The modern marketing stack separates concerns cleanly: one tool per job, each replaceable without rebuilding the whole system. Here is how that plays out across team sizes.
Starter stack (1–3 person team, under $2M ad spend):
- Warehouse: Google BigQuery (pay-per-query, no infrastructure to manage, integrates natively with Google Analytics and Looker Studio)
- ELT: Airbyte (open-source, lower cost, good connector coverage for common marketing sources)
- Modeling: dbt Core (free, SQL-based, version-controlled transformations)
- BI: Looker Studio (free, connects directly to BigQuery)
Mid-market stack (4–10 person team, $2M–$20M ad spend):
- Warehouse: Snowflake (strong concurrency, excellent governance features, cloud-agnostic)
- ELT: Fivetran (managed connectors, automatic schema migration, lower maintenance burden than self-hosted Airbyte)
- Modeling: dbt Cloud (managed runs, documentation, lineage graph, alerting)
- BI: Tableau or Looker (Tableau for ad hoc exploration; Looker for governed, embedded metrics)
Enterprise stack ($20M+ ad spend, multi-brand or agency):
- Warehouse: Snowflake or Databricks (Databricks if you need ML pipelines alongside analytics; Snowflake if governance and concurrency are the priority)
- ELT: Fivetran plus custom connectors for proprietary sources
- Modeling: dbt Cloud with dbt Mesh for cross-team model sharing
- BI: Looker or Tableau with row-level security and embedded dashboards
A few notes on specific tools:
Fivetran vs. Airbyte: Managed connectors like Fivetran reduce long-term maintenance cost and handle schema changes automatically. Airbyte is cheaper and open-source, but someone on your team owns the connector maintenance. For teams without a dedicated data engineer, Fivetran’s managed approach typically wins.
Databricks: Best when you need ML and analytics in the same platform. Its Unity Catalog handles governance across both, and its conversational BI feature (Genie) lets non-technical campaign managers query governed data in plain language.
Google Analytics and Salesforce as sources: Both are standard ingestion targets, not warehouse replacements. GA4 exports raw event data to BigQuery natively, which is one of the strongest arguments for BigQuery as a starter warehouse if you are already on Google’s stack. Salesforce data lands via Fivetran or Airbyte and becomes the revenue ground truth for attribution.
Amazon Redshift is the natural choice for teams already deep in AWS. Its performance tuning options and native integrations with S3, Lambda, and AWS Glue make it efficient for AWS-centric architectures, though it requires more infrastructure management than BigQuery or Snowflake.
For practical guidance on presenting warehouse outputs to stakeholders, the marketing analytics best practices guide covers how to structure business-facing marts and reporting layers for non-technical audiences.
How to choose the right warehouse and tools for your marketing team
The decision is less about raw capability and more about fit with your existing environment. BigQuery, Snowflake, and Redshift are all production-ready. The selection usually follows your cloud provider and your team’s SQL skills, not benchmark scores.
Decision checklist:
- Existing cloud provider: Already on GCP? BigQuery is the path of least resistance. AWS-native? Redshift. No strong preference? Snowflake’s cloud-agnostic architecture gives you flexibility.
- Query volume patterns: High concurrency (many analysts querying simultaneously)? Snowflake’s multi-cluster warehouses handle this well. Sporadic, large analytical queries? BigQuery’s on-demand pricing keeps costs low.
- Analyst skillset: All SQL, no Python? Any of the three works. Need ML pipelines alongside analytics? Databricks.
- Budget: BigQuery’s pay-per-query model is cheapest at low volumes. Snowflake and Redshift have compute credits that require more active cost management.
- Governance needs: Snowflake’s column-level security and data sharing features are mature. Databricks Unity Catalog is strong for organizations that need ML and analytics governance in one place.
- Integration requirements: If Salesforce is your CRM, Fivetran’s Salesforce connector is the most reliable. If you are GA4-first, BigQuery’s native export is hard to beat.
Migration and vendor lock: dbt models are SQL and largely portable across warehouses. The biggest lock-in risk is proprietary SQL syntax and warehouse-specific functions. Write standard SQL where possible and document any warehouse-specific functions you use.
Pro Tip: Model for the business questions you need to answer, not for the tools you currently have. Build marts like mart_ltv_by_channel or mart_cohort_retention that answer real marketing questions. If you model only for the dashboard you have today, you will rebuild everything the next time a stakeholder asks a question the dashboard cannot answer.
A practical 90-day implementation plan
This timeline comes from Pedowitz Group’s build framework and reflects the pattern most marketing analytics teams follow in practice.
| Phase | Days | Key activities | Owner | KPI |
|---|---|---|---|---|
| Foundations | 1–30 | Select warehouse, set up ELT connectors for CRM + top 2 ad platforms + web analytics, establish naming conventions and governance, stand up ingestion monitoring | Data engineering + marketing ops | All priority sources ingesting daily with zero failures |
| Modeling & validation | 31–60 | Build dbt staging and core models, implement identity stitching, publish channel ROAS and spend marts, run schema tests | Analytics engineering | Core marts passing all dbt tests; identity match rate above — |
| Activation & measurement | 61–90 | Deploy reverse ETL audiences, build attribution model, ship executive dashboard, set freshness SLAs | Analytics engineering + marketing ops | Executive dashboard live; first reverse ETL audience pushed to ad platform |
Phase 1 gotchas: API rate limits on ad platforms will slow your first ingestion runs. Build in buffer time and start with historical backfills during off-peak hours. Establish your taxonomy (campaign naming conventions, UTM standards) before you model, not after.
Phase 2 gotchas: Identity stitching is where most projects stall. Start with deterministic matching only (email, phone) and document your match logic. Probabilistic matching can come later once deterministic coverage is measured.
Phase 3 gotchas: Reverse ETL audiences require consent validation before they go to ad platforms. Build a consent flag check into your mart before pushing any PII-derived segment. Also, executive dashboards that show too many metrics get ignored. Ship one page with five numbers: total spend, blended ROAS, CAC by channel, pipeline influenced, and LTV trend.
Pro Tip: Ship the executive dashboard in week eight, not week twelve. An early win builds organizational trust in the warehouse and protects the project from being deprioritized when competing initiatives appear.

What it costs and the main cost drivers
Warehouse costs have three components: storage, compute, and connectors. Most teams underestimate connector costs and overestimate storage costs.
Typical ranges by team size:
- Small team (under $2M ad spend): $200–$800/month total. BigQuery on-demand plus Airbyte open-source plus dbt Core keeps costs near the low end. Fivetran adds $300–$500/month depending on connector count.
- Mid-market ($2M–$20M ad spend): $1,500–$5,000/month. Snowflake compute credits, Fivetran managed connectors, and dbt Cloud account for most of the spend.
- Enterprise ($20M+ ad spend): $8,000–$30,000+/month. Costs scale with query volume, concurrent users, data retention, and the number of reverse ETL destinations.
Main cost levers:
- Query frequency: Scheduled queries that run every 15 minutes cost far more than hourly or daily runs. Audit your scheduled queries and push most to hourly.
- Storage retention: Raw staging tables accumulate fast. Archive data older than 90 days to cold storage (BigQuery’s long-term storage tier, Snowflake’s storage compression) to cut costs significantly.
- Connector costs: Fivetran prices by monthly active rows (MAR). High-volume sources like ad impression logs can spike MAR counts. Use Airbyte for high-volume, low-complexity sources and Fivetran for complex, schema-heavy sources like Salesforce.
- Modeling compute: dbt runs consume warehouse compute. Schedule full refreshes during off-peak hours and use incremental models for large tables.
- Reverse ETL volume: Pricing scales with the number of records synced per month. Suppress inactive records from sync to control costs.
Cost control tactics: Partition large fact tables by date so queries scan only the relevant date range. Cache frequently-run dashboard queries. Aggregate raw impression data into daily summaries before storing long-term.
Common challenges and how to avoid them
Identity and match-rate problems are the most common reason warehouse projects stall. Design deterministic-first stitching: match on exact email, then exact phone, then device ID with session proximity. Document every match rule in dbt and test it. Probabilistic matching belongs in a separate model, clearly labeled, so analysts know which records carry uncertainty.

Schema drift and connector breakage happen when source platforms change their API response structure. Managed connectors like Fivetran handle most schema changes automatically. For custom connectors, implement dbt schema tests on every staging model so a breaking change surfaces in your monitoring before it corrupts a downstream mart.
Governance and trust: Without data contracts, every team builds its own definition of “conversion” and “revenue.” Establish naming standards and a data dictionary before you publish marts. Use dbt’s documentation features to attach definitions to every column. Set freshness SLAs (for example, “channel ROAS mart must refresh by 7 AM daily”) and alert on failures.
Pro Tip: Deliver the executive dashboard before self-serve access. Executives who trust the numbers become internal advocates for the warehouse. Self-serve access without trust leads to shadow spreadsheets that undermine the whole project.
Organizational adoption is the failure mode nobody plans for. Analysts who built the old spreadsheet reports will resist a system that makes those reports redundant. Involve them in the modeling phase. Let them define the business logic for the marts they own. Adoption follows ownership.
For governance and consent handling specific to marketing data, Getpaidlens publishes its security and data protection documentation as a reference for teams building consent-aware pipelines.
How to activate warehouse outputs: reverse ETL and practical patterns
Reverse ETL is the process of pushing modeled warehouse outputs back to operational tools: ad platforms, CRMs, email tools, and CDPs. It closes the loop between analysis and action.
When to push and what to push:
- Audience suppression: Push a list of recent converters from your warehouse to Google Ads and Meta to suppress them from acquisition campaigns. This reduces wasted spend immediately and is one of the fastest-payback activation patterns.
- Lookalike seeds: Push your highest-LTV customers (modeled in the warehouse) as a seed audience to Meta or TikTok. Warehouse-derived seeds are cleaner than platform-native lookalikes because they are based on actual revenue data, not platform-observed behavior.
- Server-side conversion APIs: With privacy-driven signal loss accelerating, sending hashed, consented conversions from your warehouse directly to Google’s Enhanced Conversions API and Meta’s Conversions API preserves measurement quality that browser-based tracking can no longer guarantee.
- CRM scoring: Push propensity-to-convert scores from the warehouse into Salesforce or HubSpot so sales teams prioritize the right leads without needing to query the warehouse themselves.
Latency and consent: Reverse ETL runs on a schedule, typically hourly or daily. For suppression use cases, daily is usually sufficient. For bid optimization signals, hourly is better. Before any PII-derived audience leaves the warehouse, validate that the consent flag is set to “opted in for advertising use.” Build this check into the mart, not the reverse ETL job, so it cannot be bypassed.
Business impact: Teams that implement server-side conversion APIs alongside warehouse-based audience suppression typically see improved match rates on ad platforms and more accurate automated bidding. The warehouse provides the clean, consented signal; the platform uses it to bid more efficiently.
Quick-start checklist: what to connect first and the first five reports to ship
Connect these sources in order of attribution impact:
- CRM (Salesforce or HubSpot): Your revenue ground truth. Nothing else makes sense without it.
- Primary ad platforms: Google Ads and Meta first, then LinkedIn, TikTok, and others by spend volume.
- Web analytics (Google Analytics / GA4): Session and conversion data that ties ad clicks to on-site behavior.
- Email tool (Klaviyo, Braze, or Mailchimp): Open, click, and conversion data for lifecycle attribution.
- Billing or e-commerce (Stripe, Shopify): Actual revenue at the transaction level, not platform-reported conversions.
Five reports to ship in the first 30 days:
- Executive ROAS dashboard: Total spend vs. revenue by channel, updated daily. One page, five metrics. This is the report that builds trust.
- Channel mix analysis: Spend share vs. revenue share by channel over a rolling 90-day window. Surfaces misallocation fast.
- Funnel velocity report: Time from first touch to conversion by channel and campaign. Identifies where the funnel stalls.
- Cohort retention: Revenue retention by acquisition cohort (monthly). Shows which channels bring customers who stay.
- LTV by channel: Average 12-month LTV for customers acquired through each channel. The single most important number for budget allocation decisions.
For guidance on presenting these reports to stakeholders in a way that drives decisions, the visualizing marketing data for stakeholders guide covers layout, hierarchy, and annotation practices that make dashboards readable for non-technical executives.
Minimum governance to ship trusted reports: Every metric needs one owner, one definition, and one canonical source. Document these in dbt before you publish. A report that two people interpret differently is worse than no report.
The warehouse is a long-term bet, not a quick fix
Most articles on marketing data warehouses treat the build as the finish line. It is not. The warehouse is infrastructure, and infrastructure only pays back when it is used consistently and maintained over time.
Here is the honest framing: a warehouse-first strategy makes sense when your team has at least one person who can write SQL, when you are running more than five paid channels, and when attribution questions come up in every weekly review. If you are a solo marketer running two channels with a $50K monthly budget, a CDP or a managed analytics tool will serve you better for less effort.
The ownership question matters more than most teams admit. Marketing ops teams that own the warehouse tend to model for the questions they already know. Centralized data teams that own it tend to model for technical correctness but miss the business context. The best setups pair a data engineer who owns ingestion and infrastructure with a marketing analyst who owns the marts and the business logic. Neither can do the other’s job well.
The investment pays back when you hit three signals simultaneously: more than eight active marketing tools, more than $500K in monthly ad spend, and more than ten hours per week of manual reporting. Past that point, the warehouse typically returns its cost in analyst time within the first quarter. Before that point, you are building infrastructure you are not ready to use.
One more thing worth saying plainly: the warehouse does not make decisions. It makes better decisions possible. Teams that build a warehouse and then continue to make gut-feel budget calls have spent a lot of money on a very expensive spreadsheet. The value is in the process change, not the technology.
Getpaidlens layers AI decision intelligence on top of your warehouse data
Building a warehouse gives you clean, modeled data. The next question is what to do with it every morning when you sit down to manage campaigns.
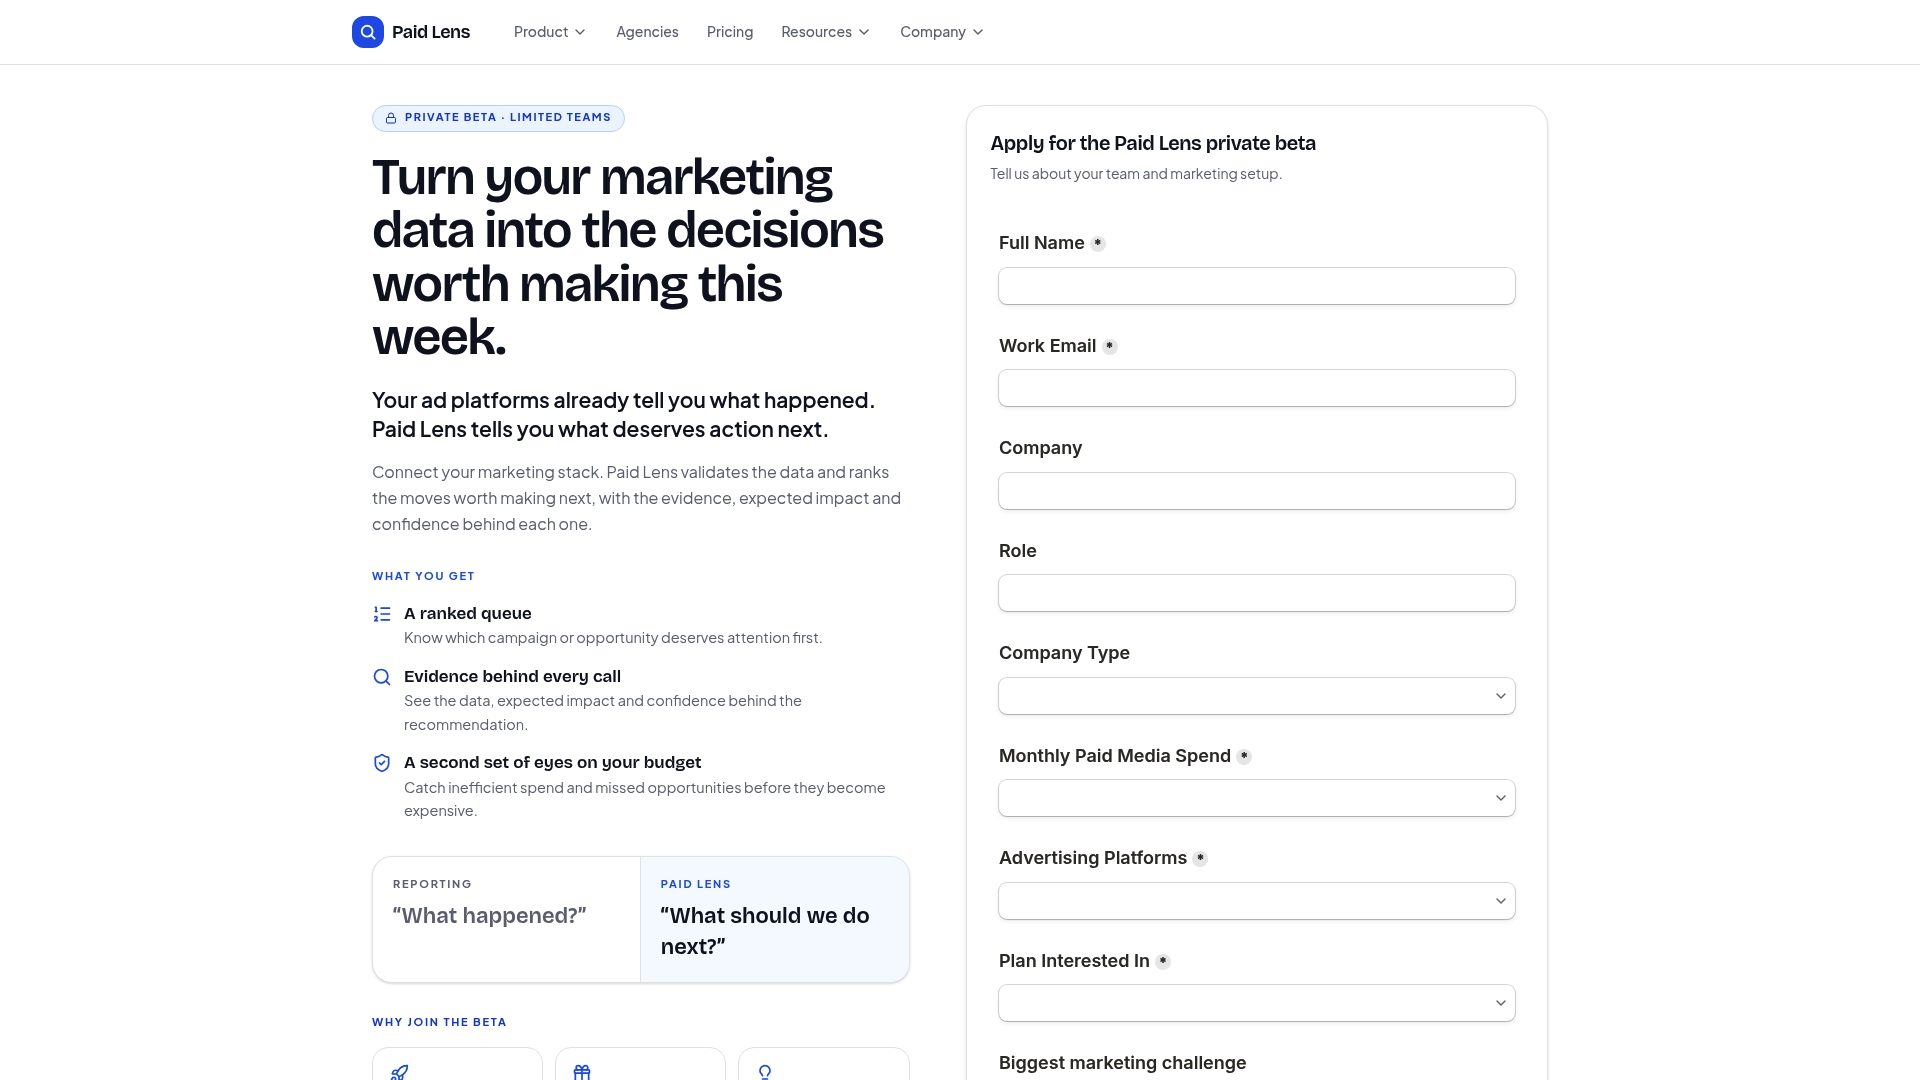
Getpaidlens connects directly to your ad platforms and revenue sources, validates data quality, standardizes attribution across platforms, and delivers a ranked queue of optimization recommendations with confidence scores. Instead of querying the warehouse yourself to find the next best action, Getpaidlens surfaces it for you, with the expected business impact explained. The AI analyst feature lets you ask questions in plain language and get answers drawn from your actual performance data, without writing SQL. For teams that have built the warehouse but still spend hours interpreting outputs, that is the gap Getpaidlens fills.
The attribution features are auditable, not black-box, so you can show a CFO exactly why a budget recommendation was made. Getpaidlens is currently in private beta. View pricing and get started to see the current plan options.
Disclosure: Getpaidlens is the publisher of this article.
Sources
These resources are worth bookmarking for implementation and deeper reference.
- How do I build a marketing data warehouse?
- How do you use a data warehouse for marketing? | Databricks
- Cdp
- Marketing Data Warehouse: What It Is & Why You Need One
- Building a Marketing Data Warehouse in 2026
FAQ
What is the role of data warehousing in marketing?
A marketing data warehouse centralizes campaign, customer, and revenue data from every platform your team runs, enabling attribution modeling, LTV analysis, cohort reporting, and cross-channel budget decisions from a single source of truth. It replaces the manual spreadsheet pulls and conflicting platform dashboards that slow most marketing teams down.
What are the top warehouses used for marketing analytics?
Google BigQuery, Snowflake, and Amazon Redshift are the three production-ready choices for marketing teams. BigQuery suits GCP-native and Google Analytics-heavy stacks; Snowflake leads on concurrency and governance; Redshift fits AWS-centric organizations. Databricks is the choice when ML pipelines and analytics need to share the same platform.
When does a marketing data warehouse actually pay off?
The payback typically arrives when a team runs 8–12 active marketing tools or spends more than 10 hours per week on manual reporting. At that point, the warehouse returns its cost in analyst time within the first quarter, before attribution improvements are even counted.
What skills does a marketing data warehousing project require?
The core skills are SQL (for modeling and analysis), basic data engineering knowledge (for ingestion and pipeline monitoring), and familiarity with a transformation tool like dbt. Marketing analysts who know SQL can own the marts layer; a data engineer handles ingestion and infrastructure. Tools like Getpaidlens reduce the SQL burden for day-to-day optimization decisions by surfacing ranked recommendations directly.