Incrementality Testing: A Practical Guide for Marketers
Learn how incrementality testing helps marketers measure true ad effectiveness, ensuring smarter spending for better outcomes.

Incrementality Testing: A Practical Guide for Marketers
Incrementality testing measures the causal lift your advertising actually caused by comparing an exposed group to a randomized holdout that saw no ads. Start with a feasibility check on your highest-spend channel: if you’re running more than a few hundred conversions per week, you likely have enough signal for a user-level holdout; if not, a geo-based experiment is your fastest path to a valid answer. The two metrics to track from day one are incremental lift (the percentage difference in conversions between exposed and holdout groups) and incremental ROAS (iROAS), which tells you the revenue generated per dollar spent on the marginal impression. Surveys tracked by EMARKETER show adoption among U.S. brand and agency marketers has crossed the majority threshold, and planned investment in incrementality measurement continues to rise heading into the next 12 months.
Key Takeaways
Incrementality testing is the only measurement method that proves causal lift, and building it as a recurring program, not a one-off test, is what separates teams that optimize on evidence from those that optimize on reported ROAS.
| Point | Details |
|---|---|
| Causal lift, not credit | Incrementality measures what ads caused, not what touchpoints got credit; iROAS often differs sharply from reported ROAS. |
| Feasibility first | Use the formula 15.68 ÷ lift² to compute conversions needed per group before committing to any test design. |
| Match design to channel | User holdouts for social and search; geo tests for retail media and OOH; synthetic controls when randomization isn’t possible. |
| Calibrate MMM and MTA | Run quarterly incrementality validation on top channels to check whether your MMM coefficients and MTA weights are directionally correct. |
| Getpaidlens operationalizes results | Getpaidlens connects ad platforms, GA4, and CRM data to rank budget recommendations by impact and confidence after each test. |
Table of Contents
- What does incrementality testing actually measure?
- How incrementality testing works in practice
- Which test design should you use?
- How to design a statistically defensible test
- How to read results without fooling yourself
- How to build a repeatable incrementality program
- Where does adoption actually stand?
- The test most teams should run first
- Getpaidlens turns incrementality results into budget decisions
- Sources
- FAQ
What does incrementality testing actually measure?
Attribution tells you which touchpoints got credit. Incrementality testing tells you which ones caused the outcome. Think with Google’s measurement guidance frames it precisely: you compare a treatment group exposed to ads against a holdout control that was not, and the difference between their conversion rates is the campaign’s causal lift. No model assumptions, no last-click bias, no multi-touch weighting debates.
Three metrics define the output:
- Absolute lift: the raw difference in conversion rate or revenue between exposed and holdout groups (e.g., 4.2% vs. 3.1% = 1.1 percentage point lift).
- Percentage lift: absolute lift divided by the holdout baseline, expressed as a percent (1.1 ÷ 3.1 = ~35%).
- Incremental ROAS (iROAS): incremental revenue divided by the ad spend that drove it. A campaign with a reported ROAS of 4x can have an iROAS below 1x if most converters would have bought anyway.
- Confidence interval / statistical significance: the range within which the true lift likely falls, typically reported at 95% confidence. A wide interval on a small test is not a result; it’s a power problem.
How incrementality compares to attribution, A/B testing, and MMM
These methods answer different questions, and confusing them is where most measurement programs go wrong.
- Multi-touch attribution (MTA): distributes credit across touchpoints using rules or data-driven models. Fast and granular, but correlational. It cannot tell you what would have happened without the ad.
- A/B testing: randomizes users to different versions of an experience (creative, landing page, bid strategy). Incrementality testing randomizes users to exposed vs. no ad, which is a different question entirely.
- Marketing mix modeling (MMM): a top-down regression approach that estimates channel contributions from aggregate data. Useful for long-run budget allocation and TV/offline channels, but too slow and too coarse for campaign-level decisions. MMM and MTA answer different strategic questions; incrementality provides the causal ground truth to validate both.
The practical rule: use MTA for daily tactical optimization, MMM for annual budget planning, and incrementality to calibrate whether either is telling you the truth.
How incrementality testing works in practice
Three experimental designs cover the vast majority of real-world use cases. Each creates a control group differently, and the right choice depends on your channel, conversion volume, and platform access.
Randomized user-level holdouts
Most major ad platforms offer built-in conversion lift tests that randomly assign users to exposed or holdout at the user or cookie level. The holdout group typically receives no ads, and the platform tracks conversions in both groups to estimate incremental lift.
Geo-based experiments
When user-level holdouts aren’t feasible, matched-market geo tests are the practical alternative. You select pairs of geographic markets with similar baseline conversion trends, assign one to treatment and one to holdout, run the campaign in treatment markets only, and measure the difference. Matching quality is everything here: markets need to move together historically before the test starts, or the comparison is meaningless. Duration matters too. Most geo tests need at least four weeks to absorb weekly seasonality, and eight weeks is safer for channels with longer purchase cycles.

Synthetic controls and matched-market modeling
When you can’t randomize at all (think national TV, a major brand campaign, or a channel where holdouts would be commercially unacceptable), synthetic control methods construct a statistical counterfactual from a weighted combination of control units. Amplitude’s experimentation guidance recommends connecting this kind of modeling directly to analytics pipelines so the counterfactual updates continuously rather than requiring a one-time manual build.
Real-world examples worth knowing:
Uber used geo-based holdout experiments to discover that a significant portion of its paid search spend was capturing riders who would have converted organically, leading to a major reallocation of budget. Kroger Precision Marketing built incrementality measurement into its retail media offering as a standard deliverable, making causal lift a default accountability metric for CPG advertisers. Mondelēz, working through matched-market approaches similar to those Haus has documented, found that retail media incrementality varied substantially by category and retailer, which shifted how they allocated trade budgets across accounts.
Which test design should you use?
The right design follows from your channel and your conversion volume, not from what sounds most rigorous.
| Design | Best for | Minimum signal needed | Contamination risk | Speed |
|---|---|---|---|---|
| User-level holdout | Social, search, app | a few hundred conversions per week | Low (platform-controlled) | Fast (2–4 weeks) |
| Geo experiment | Retail media, TV, OOH, low-volume search | Moderate (market-level trends) | Medium (spillover between markets) | Moderate (4–8 weeks) |
| Synthetic control | National campaigns, no holdout feasible | Historical time-series data | Low (no treatment contamination) | Slow (8+ weeks + modeling) |
Channel-to-design mapping in plain terms:
- Search and shopping: user-level holdouts work well when weekly conversions are sufficient; geo tests when volume is too thin.
- Paid social (Meta, TikTok): platform lift tests are the fastest path; run them for at least two full purchase cycles.
- Retail media (Amazon, Kroger, Walmart Connect): geo or matched-market approaches are standard because user-level holdouts often aren’t available to the advertiser directly.
- TV and OOH: synthetic controls or geo tests are the only options; randomization at the user level is not possible.
One situation where synthetic controls beat randomized holdouts regardless of volume: when the holdout would require withholding ads from a commercially important segment for long enough that the revenue trade-off is unacceptable to the business. In those cases, a longer synthetic control window with a pre-registered decision rule is more defensible than a short, underpowered holdout.
Pro Tip: *Before committing to a design, run a pre-test power check using historical conversion data.
How to design a statistically defensible test
A test that can’t detect the lift you care about is not a test. It’s a spend.
Design checklist:
- Define the decision first. What budget or channel choice will this test inform? A test without a pre-committed decision rule produces data, not decisions.
- Set your minimum detectable lift (MDL). What’s the smallest lift that would change your budget allocation? If a 5% lift wouldn’t move anything, don’t design for 5%.
- Compute conversions needed per group. Soku’s formula at 95% confidence and 80% power: conversions needed per group ≈ 15.68 ÷ (relative lift)². A 10% lift requires roughly 1,568 conversions per group; a 20% lift drops that to ~392.
- Size the holdout. A 10% holdout on a campaign generating 500 weekly conversions gives you 50 holdout conversions per week. At that rate, detecting a 20% lift takes roughly 8 weeks. Larger holdouts buy power faster but cost more in withheld revenue.
- Choose duration based on conversion lag. Add your average consideration window to the minimum statistical window. A 7-day purchase cycle needs at least 2–3 weeks of data; a 30-day cycle needs 6–8 weeks minimum.
- Instrument measurement before launch. Confirm your conversion tracking fires correctly in both groups before the test starts. Post-hoc instrumentation fixes are not valid.
- Pre-register your decision rule. Write down: “If iROAS exceeds X at 95% confidence, we increase spend by Y%. If the 95% CI upper bound is below Z%, we pause the channel.” Commit to it before you see results.
Conversions needed by target lift (95% confidence, 80% power)
| Target lift | Conversions per group | Weekly conversions needed (10% holdout) |
|---|---|---|
| 5% | 15.68 ÷ (relative lift)² formula output | 15.68 ÷ (relative lift)² formula output |
| 10% | ~1,568 | 15,680 |
| 15% | ~697 | ~6,970 |
| 20% | ~392 | ~3,920 |
| 30% | ~174 | ~1,740 |
Worked iROAS example
Absolute lift is 0.9 percentage points. Incremental conversions: 90,000 × 0.009 = 810.
Pro Tip: Bayesian and sequential testing methods can let you stop a test early when evidence is strong enough, reducing the revenue cost of holding out a control group. They work best when you have high daily conversion volume and a clear stopping rule. For low-volume channels, they tend to produce inconclusive results faster than a fixed-horizon design would, so don’t treat them as a universal shortcut.
How to read results without fooling yourself
A statistically significant result is not automatically a business-significant one. And a null result is not proof that your ads don’t work.
Common pitfalls:
- Contamination: holdout users who see your ads through a different device, a partner channel, or organic search. Geo tests are especially vulnerable if markets share media (e.g., a DMA that overlaps state lines).
- Regression to the mean: if you selected high-performing markets for treatment, they may have been in a temporary spike. Always match on a pre-period trend, not a single high-performance week.
- Seasonality and concurrent changes: a promotion, a competitor’s campaign, or a platform algorithm change during the test window can confound results. Pre-register start and end dates and freeze other major campaign changes during the test.
- Underpowered null results: a test that shows no significant lift might mean the ads don’t work, or it might mean you didn’t have enough conversions to detect the lift that exists. These are not the same thing.
Reporting standards that hold up to scrutiny:
“No significant lift detected” is not, because it conflates absence of evidence with evidence of absence.
How to build a repeatable incrementality program
A single test answers one question. A program answers the questions your business keeps asking.
- Prioritize channels by spend and testability. Rank your top five channels by budget. Cross-reference against conversion volume and holdout feasibility. Start with the channel that is both high-spend and testable.
- Run a feasibility check before every test. Use the conversions-needed table above. If you can’t reach the required volume in a reasonable window, switch to a geo or synthetic design before you start.
- Build standard templates. A pre-registered test brief (decision, MDL, design, duration, holdout size, KPIs, decision rule) should take 30 minutes to complete, not a week of back-and-forth.
- Set a recurring cadence. Quarterly validation tests on top channels is the standard for most organizations. High-turnover creative or retail promotions may warrant monthly pilots. Annual-only testing is too slow to influence real budget decisions.
- Assign clear ownership. Marketing owns the test brief and decision commitment. Analytics leads the design, power calculation, and result interpretation. Finance or a senior stakeholder signs off on the holdout trade-off before launch. Platform ops instruments and QAs the tracking.
- Use results to calibrate MMM and MTA. Incrementality provides the causal ground truth that validates whether your MMM coefficients and MTA weights are directionally correct. When an incrementality test contradicts your MMM output for a channel, that’s a signal to re-examine the model’s assumptions, not to average the two answers.
On tooling: integrated analytics platforms that connect ad data, CRM revenue, and experiment tracking reduce the manual work that kills most programs. Getpaidlens’s data connections across ad platforms, GA4, and CRM sources help teams instrument tests reliably and pull results into a single reporting layer, which cuts the time between test completion and budget decision. Harvard Business Review’s analysis frames experiment-driven measurement as the rising standard precisely because organizations that automate the instrumentation and reporting cycle run more tests, learn faster, and compound their measurement advantage over time.
Where does adoption actually stand?
EMARKETER’s analysis shows adoption among U.S. brand and agency marketers has crossed the majority threshold, with many planning to increase incrementality spending over the next 12 months. That’s a meaningful shift from two years ago, when incrementality was largely a capability held by large platforms and a handful of sophisticated advertisers.
The barriers keeping the other half from adopting are consistent across industry reports:
- Accuracy and trust concerns: teams that have run underpowered tests and gotten noisy results often conclude that incrementality doesn’t work, when the real problem was insufficient conversion volume.
- Application complexity: designing a valid test, computing power, and interpreting confidence intervals requires skills that most marketing teams don’t have in-house without support.
- Limited tooling integration: when incrementality results live in a spreadsheet disconnected from the ad platform and the attribution model, they don’t influence decisions. They become a quarterly slide deck that nobody acts on.
Privacy-related tracking loss is accelerating adoption faster than any internal advocacy campaign could. As cookie-based attribution erodes, incrementality becomes one of the few measurement methods that doesn’t depend on individual user tracking. Retail media accountability is a parallel driver: CPG brands and their retail partners increasingly require causal lift as a standard deliverable, not an optional add-on.
Three things that actually move adoption forward:
- Executive alignment on the short-term revenue trade-off of holding out a control group. Without it, every test gets cancelled when a sales target is at risk.
- Starting with the highest-spend channel where the business case for a valid answer is clearest.
- Integrating incrementality results into the annual planning cycle so they inform budget allocation, not just post-campaign reporting.
For practical guidance on building the organizational case, the TBE Agency blog covers measurement leadership and change management in marketing organizations.
The test most teams should run first
The channel that deserves your first incrementality test is almost always paid search, specifically branded search. Most teams assume branded keywords are high-intent and high-ROAS, and they’re right on both counts. What they don’t know is how much of that conversion volume is organic demand that would have found the brand anyway. Uber’s geo holdout experiment on branded search is the canonical example: the answer was uncomfortable, and it changed how they allocated tens of millions in budget.

If branded search volume is too thin for a user-level holdout, run a geo test in two matched markets. The test doesn’t need to be large. It needs to be valid.
Pro Tip: Size your holdout to buy statistical power, not to minimize revenue risk. The revenue cost of the holdout is almost always smaller than the cost of running an inconclusive test and making the wrong budget decision for another year.
One commitment before any test launches: run the conversions-needed calculation. If the math doesn’t work for your current volume and your target lift, change the design before you start, not after you’ve spent four weeks collecting data you can’t interpret.
Getpaidlens turns incrementality results into budget decisions
Most incrementality programs stall not because the tests fail, but because the results don’t connect to the next action. Getpaidlens is built specifically for that gap. It connects your ad platforms, GA4, and CRM into a single auditable layer, then ranks optimization recommendations by expected business impact and confidence score, so your team knows which budget moves to make first after a test concludes.
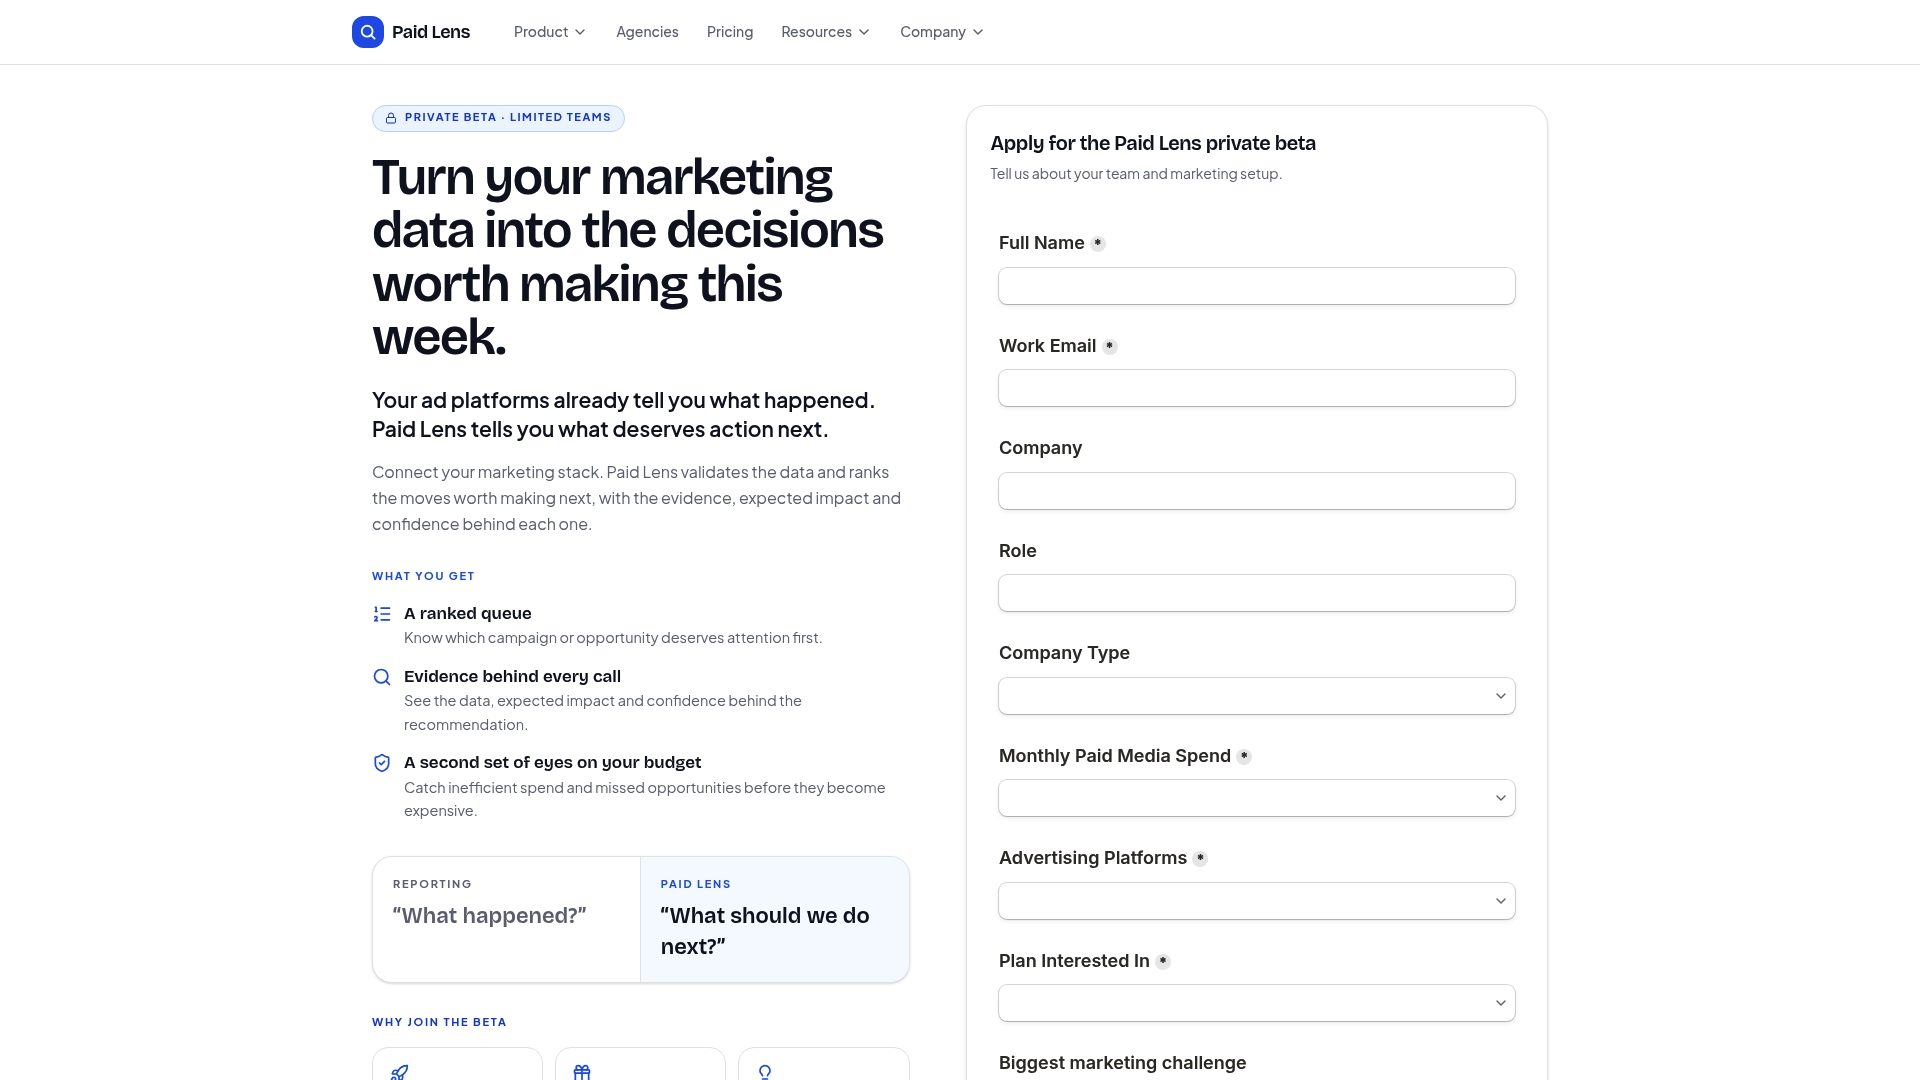
The attribution and iROAS reporting inside Getpaidlens gives you a clear view of incremental performance across channels without rebuilding a spreadsheet after every test cycle. Teams use it to run pilot feasibility checks, validate MMM and MTA outputs against causal lift results, and produce executive-ready reporting that ties test findings to spend recommendations. The AI analyst layer lets you query performance data in plain language, which cuts the time from test result to stakeholder decision from days to minutes. If you’re ready to move from one-off tests to a repeatable incrementality program, see how Getpaidlens works or explore pricing and plans to find the right fit for your team.
Sources
- Use incrementality testing for effective marketing measurement (Think with Google)
- FAQ on incrementality: How to prove your ads actually work in 2026 (EMARKETER)
- What is incrementality testing? - Amplitude
- A new gold standard for digital ad measurement (Harvard Business Review)
FAQ
What is an example of an incrementality test?
How does incrementality testing differ from A/B testing?
A/B testing compares two versions of an ad or experience to find which performs better. Incrementality testing compares an exposed group to a group that saw no ad at all, answering whether the ad caused any outcome rather than which version caused more.
What is the difference between MMM and incrementality testing?
MMM uses aggregate historical data to estimate channel contributions across long time horizons, making it useful for annual budget planning. Incrementality testing runs a controlled experiment to measure causal lift for a specific campaign or channel, producing a result that can validate or contradict what the MMM model predicts.
How many conversions do you need to run a valid incrementality test?
Detecting smaller lifts requires substantially more conversions; larger lifts require fewer.
Can incrementality testing work without cookies?
Yes. Randomized holdouts and geo-based experiments don’t depend on individual user tracking. They measure aggregate conversion differences between groups, which makes them one of the most durable measurement methods in a privacy-first environment.