What Is Markov Attribution and When Should You Use It?
Discover how Markov attribution effectively assigns conversion credit across channels. Learn when to use it for multi-touch marketing success.

What Is Markov Attribution and When Should You Use It?
Markov attribution assigns conversion credit by modeling each touchpoint as a state in a chain, then measuring how much conversion probability drops when you remove that touchpoint. That drop, called the removal effect, becomes the channel’s credit share. It’s the closest thing to data-driven attribution most teams can run without a full incrementality testing program.
Use it when you have multi-touch journeys and enough stitched, user-level data to build a real transition matrix. Skip it when your tracking is broken across devices, when a large share of conversions happen offline, or when you’re trying to measure channels that live outside paid search and display entirely, like organic AI search referrals, which get zero credit no matter how influential they were. The core caveat never goes away: this is a modeled removal effect, not proof of causation. A 2021 e-commerce study found Markov models pull credit away from last-touch favorites, and Google’s ADH.TOUCHPOINT_ANALYSIS function won’t even run on a touchpoint pairing until it clears 50 converting and 50 non-converting users.
- Use it for: multi-touch journeys with clean, stitched user IDs across platforms
- Don’t use it for: sparse data, heavy offline conversion, or measuring untracked/AI search influence
- Watch for: removal effect measures correlation-adjusted influence, not guaranteed causal lift
Key Takeaways
Markov attribution measures modeled removal effects to assign credit, which makes it a strong tactical tool but not a substitute for causal experiments.
| Point | Details |
|---|---|
| Removal effect is the core metric | Credit comes from how much conversion probability drops when a channel is removed from the chain. |
| Data quality decides accuracy | Broken user stitching and sparse channel pairs produce unstable, unreliable transition matrices. |
| Privacy thresholds shape coverage | Platforms like ADH require at least 50 converting and 50 non-converting users per touchpoint before including it. |
| Validate before you reallocate budget | Bootstrap confidence intervals and holdout experiments catch conversion hijacking and sensitivity issues. |
| Paid Lens automates the operational layer | It stitches cross-platform data, flags quality issues, and recalculates attribution with ranked, confidence-scored recommendations. |
Table of Contents
- What Is a Markov Chain in Marketing Attribution?
- How to Build the Chain From Your Journey Data
- How the Removal Effect Is Actually Calculated
- Data Requirements and Privacy Thresholds That Change Your Results
- Choosing Where to Run Markov Attribution
- Turning Removal Effects Into Budget Decisions
- Where Markov Attribution Breaks Down
- A Step-by-Step Workflow for Running It Yourself
- Where This Fits in Your Measurement Stack
- Where Paid Lens Fits Into Your Attribution Workflow
- Sources
- FAQ
What Is a Markov Chain in Marketing Attribution?
A Markov chain is a system that moves between states, where the probability of the next state depends only on the current one, not the full history that got you there. That’s the Markov property, sometimes called memorylessness, and Wikipedia’s overview of Markov chains lays out the math behind why this simplification works for a surprising range of real-world sequences.
In marketing, the states are your channels: paid search, email, display, organic social, direct. Every customer journey becomes a path through these states, starting at a Start node and ending in one of two absorbing states: Conversion or Null (no conversion, session ends). Once a path hits an absorbing state, it stops. You build the transition matrix by counting how often journeys move from one channel to the next, across every observed path, then converting those counts into probabilities.
The removal effect is where the model earns its keep. Take your baseline conversion probability across all paths. Then block one channel entirely, forcing any path that would have passed through it to fail instead, and recompute the conversion probability. The size of the drop is that channel’s contribution. Email’s removal effect is 0.12, before you normalize it against every other channel’s effect to get a clean credit share.
- The Markov property assumes the next step depends only on the current channel, not the full path history
- Absorbing states (Conversion, Null) stop the chain and anchor the probability calculation
- Removal effect isolates one channel’s marginal contribution to overall conversion probability
Pro Tip: Higher-order chains (looking back two or three touchpoints instead of one) capture sequence effects a first-order model misses, like “email after a paid search click behaves differently than email alone.” But every order increase multiplies your data requirements. Only go higher-order once your first-order model is stable and you’ve got the volume to support it.
How to Build the Chain From Your Journey Data
Raw event logs won’t feed a Markov model as-is. You need a structured table of ordered touchpoint sequences per user, and getting there takes real preprocessing discipline.
- Stitch identity across platforms. Resolve a single user_id across ad platforms, your CRM, and web analytics before anything else. Broken stitching is the single biggest source of bad attribution output.
- Order touchpoints by event_time. Sequence matters for transition counting, so timestamps need to be reliable and in a consistent timezone.
- Normalize channel names. “paid_search,” “Paid Search,” and “google_cpc” need to collapse into one canonical label or your transition matrix fragments into noise.
- Deduplicate rapid repeat clicks. A user clicking the same ad twice in three seconds is one touchpoint, not two.
- Set sessionization rules. Decide how much idle time closes a session, and apply it consistently across every channel.
- Decide how to treat single-touch paths. Some teams exclude them from transition counting since they add no sequence information; others keep them to preserve true baseline conversion rates.
Say one user’s journey is Display → Email → Paid Search → Conversion, and another is Display → Paid Search → Conversion. That gives you transition pairs (Start→Display), (Display→Email), (Email→Paid Search), (Paid Search→Conversion) from the first, and (Start→Display), (Display→Paid Search), (Paid Search→Conversion) from the second. Aggregate those counts across thousands of journeys and you have your matrix.
Broken stitching shows up as an unnaturally high share of single-touchpoint paths and a Null-heavy transition matrix, because journeys that actually continued on another device look like they died. That bias systematically under-credits assist channels and over-credits whatever touchpoint happens to close the sale on the device you tracked best.

How the Removal Effect Is Actually Calculated
The math behind removal effect is more intuitive than it looks. You build a transition probability matrix from observed journeys, calculate the baseline probability of conversion across all paths, then remove one channel state and recalculate. MetricGate’s documentation formalizes this as RE_c = 1 − P(conversion | channel c removed) / P(conversion), which just means: how much of your conversion probability evaporates without this channel.
There are two practical ways to get that removed-state probability. The direct approximation approach uses linear algebra, solving for absorbing probabilities in the modified matrix mathematically. It’s fast and exact for the matrix you built. The synthesis approach instead generates thousands of synthetic paths using the modified transition probabilities and estimates P(conversion) empirically from that simulation, which the open-source MarkovAttribution package supports as a synthesize mode alongside its approximate linear-algebra mode.
| Approach | Runtime | Small-sample accuracy | Repeatability |
|---|---|---|---|
| Direct approximation (linear algebra) | Fast, matrix-size dependent | Exact for the given matrix | Fully deterministic |
| Synthesis (simulated paths) | Slower, scales with path count | Can be noisy below ~10,000 simulated paths | Varies run to run unless seeded |
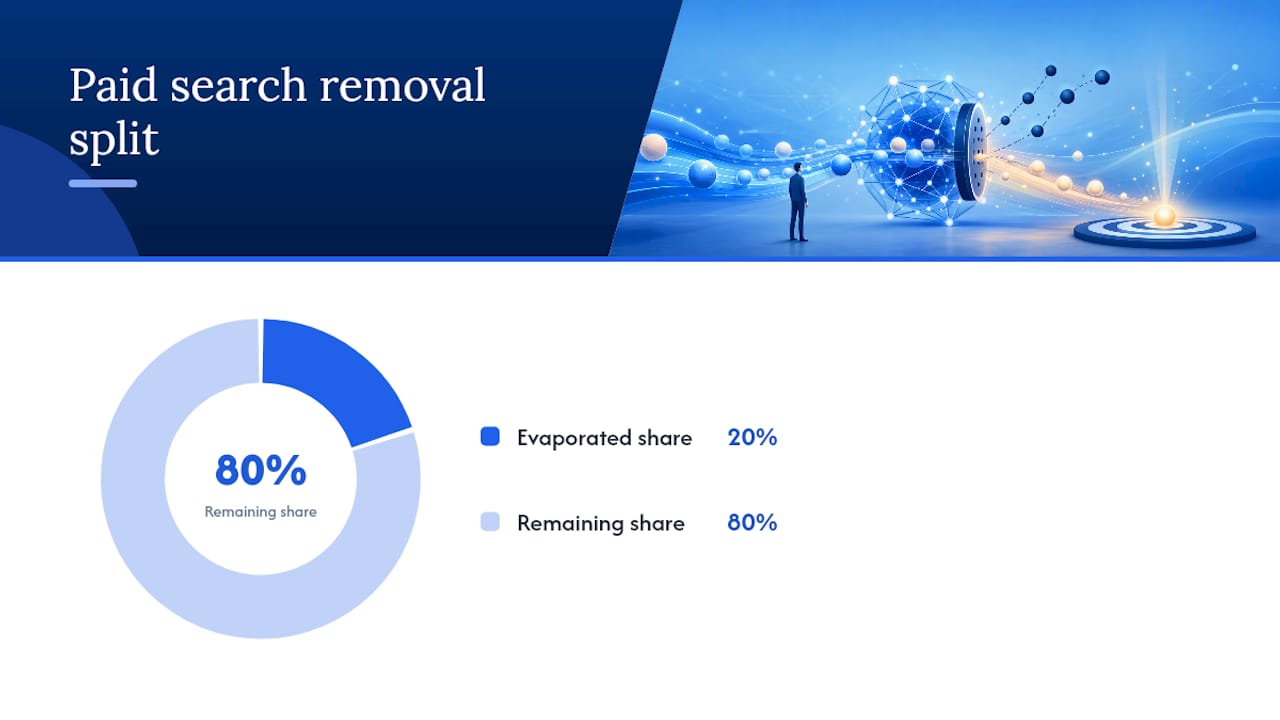
Here’s the intuition in one line: if baseline P(conversion) across all paths is 0.045, and removing paid search drops it to 0.036, the removal effect is 1 − (0.036/0.045) = 0.20.
- Direct approximation suits smaller channel sets where matrix inversion stays computationally cheap
- Synthesis handles larger, messier journey data better but needs enough simulated paths to stabilize
- Markov chains are computationally lighter than Shapley value methods since they use matrix operations instead of evaluating every possible channel coalition, which matters once you’re past a handful of channels
Data Requirements and Privacy Thresholds That Change Your Results
Your Markov model is only as good as four columns: user_id (stitched across sources), touchpoint/channel (normalized taxonomy), event_time or position (ordered sequence), and a conversion flag or value. Sanity check each one before you trust any output. Run a distinct count on channel names first, since a taxonomy with 40 near-duplicate labels will quietly wreck your transition matrix.
Volume matters more than most analysts expect. Google’s ADH enforces a hard floor: any touchpoint pairing needs at least 50 converting and 50 non-converting users before it clears the privacy filter and gets included in the model. Channels below that threshold get dropped silently unless you’re logging what’s filtered.
| Requirement | Typical minimum | Why it matters |
|---|---|---|
| Converting users per touchpoint | 50+ (ADH threshold) | Below this, privacy filters exclude the channel entirely |
| Non-converting users per touchpoint | 50+ (ADH threshold) | Same filter applies symmetrically |
| Transition-type coverage | ~10x possible transition types | Higher-order chains need proportionally more data to stabilize |
The most common preprocessing mistakes are double-counting server-side and client-side events for the same conversion, collapsing channel taxonomy too aggressively (losing useful signal) or not enough (fragmenting the matrix), and dropping server-side conversions entirely because they weren’t stitched to a session. Each shows up as an implausible spike or crater in one channel’s removal effect that doesn’t match anything your team observed in-market.
Pro Tip: *Every time a privacy filter or preprocessing rule removes a touchpoint or user, log it. Keep a running audit trail of what got filtered and why.
Choosing Where to Run Markov Attribution
Four practical paths exist for running this in production, and they trade off differently on data control, scale, and effort.
Google ADH runs Markov attribution natively through its ADH.TOUCHPOINT_ANALYSIS function, invoking a model called MARKOV_CHAINS against a touchpoint temp table and a user-credit temp table you provide in a specific schema. It applies the 50/50 privacy filter automatically, which is a feature if you need compliance guarantees and a headache if your channels run thin.
Open-source Python, led by the MarkovAttribution package on GitHub, takes a pre-stitched DataFrame of journeys and lets you choose between approximate and synthesize calculation modes, plus how to redistribute leftover probability when a channel is removed. R users have comparable functionality through the ChannelAttribution package family.
SAS offers enterprise Markov attribution procedures documented in the SAS Help Center, built for teams already running SAS pipelines who want attribution alongside existing governance and audit tooling.
| Option | Privacy handling | Scalability | Integration effort |
|---|---|---|---|
| Google ADH | Built-in 50/50 filter, automatic | High, cloud-native | Requires temp table setup, Google Ads data access |
| Open-source Python/R | Manual, you control thresholds | Moderate, script-dependent | Low if data is already stitched |
| SAS | Enterprise governance controls | High | Higher, needs SAS licensing and pipeline |
Whatever you pick, the integration checklist looks the same: confirm data access to every ad platform, resolve identity stitching, generate the required temp tables or DataFrames, schedule the compute run, and decide where results land for reporting. Version your transition matrix and channel taxonomy definitions so a rerun six months from now is comparable to today’s.
Turning Removal Effects Into Budget Decisions
A removal-effect share isn’t a budget allocation, it’s an input to one. Treat the highest-confidence signals as pilot candidates, not immediate wholesale reallocation triggers.
Start small: if a channel’s removal effect is meaningfully higher than its current budget share, test a modest bid or budget increase, watch conversion volume and cost per acquisition for two to three weeks, and only scale further if the pilot holds. If a channel shows high volume but low removal effect, don’t cut it outright. Investigate first. It might be a genuine assist channel that a first-order model is underweighting because its influence flows through a longer sequence.
A useful example: if display shows a removal effect 10 percentage points higher than last-touch reporting suggested, that justifies a staged 15 to 20% budget increase over one pilot cycle with weekly monitoring, not an immediate doubling of spend. Markov output tells you where to look; it doesn’t replace watching what actually happens when you act on it.
Pro Tip: Pair Markov output with a holdout or geo-based incrementality test before making a major reallocation. Markov attribution can be fooled by conversion hijacking, where a channel captures already-convinced customers right before they buy and gets credited for a decision made elsewhere. An experiment is the only way to catch that.
Where Markov Attribution Breaks Down
Every attribution model has blind spots, and Markov’s are specific enough to plan around rather than dismiss.
The Markov property itself is a simplification: a first-order chain assumes the next step depends only on the current channel, ignoring everything that came before it. Sparse channel pairs produce unstable transition probabilities that swing wildly between runs. Untracked and offline touchpoints, including influence from AI-powered search results, get zero credit no matter how much they actually moved someone toward converting, a gap Presenc.ai’s glossary on Markov attribution flags directly. And closing channels can still absorb credit that rightfully belongs to whatever convinced the customer earlier in the journey.
- Run bootstrap resampling to generate confidence intervals around each channel’s removal effect, not just a point estimate.
- Hold out a time window and check whether the model’s channel rankings stay consistent when you rerun it on unseen data.
- Compare against a randomized holdout or geo experiment wherever you can run one, since that’s the only source of true causal ground truth.
- Test sensitivity to sessionization and taxonomy choices by rerunning with a slightly different session-timeout rule and seeing how much rankings shift.
Higher-order chains help with sequence fidelity, and the 2021 e-commerce study found 4th and 5th order models worked best for the journeys it examined, but only after confirming enough transition data existed to support that complexity. Jumping to a 5th-order model on thin data just amplifies noise.
Pro Tip: Log every filtered channel, every excluded outlier path, and every sessionization parameter you used for a given model run. Six months later, when someone asks why a decision was made, that log is the difference between a defensible answer and a shrug.
A Step-by-Step Workflow for Running It Yourself
- Audit data quality and stitching. Confirm user_id resolution across platforms before touching the model.
- Define your channel taxonomy. Lock it down and document it so it doesn’t drift between reruns.
- Choose model order. Start first-order; move to higher-order only once volume supports it.
- Run the model and bootstrap confidence intervals. Never trust a single point estimate.
- Pilot a small budget reallocation or holdout test. Validate the model’s signal against real spend movement.
- Operationalize into reporting and budget rules. Set a recurring cadence and clear escalation triggers.
Set decision gates before you start: require a minimum of 50 converting and non-converting users per channel pairing, insist on confidence intervals narrow enough that channel rankings don’t flip between bootstrap samples, and if they do flip, treat that as a signal to run an experiment instead of trusting the model output as-is. A pilot typically runs two to eight weeks depending on conversion volume, after which most accounts move to weekly monitoring with a full model rerun monthly.
Where This Fits in Your Measurement Stack
Markov attribution earns its place as a tactical tool for optimizing spend within channels you already track well. It tells you where to shift budget among paid search, display, email, and social, not whether your brand campaign moved offline sales six weeks later. For that, you need marketing mix modeling or a real experiment.
I’d treat any single-touch attribution model, Markov included, as one input among several, never the sole basis for a major budget swing. Combine it with incrementality tests where you can and lean on MMM for the untracked, long-horizon stuff Markov structurally can’t see.
Pro Tip: Version every transition matrix and taxonomy definition you run, and revalidate against a fresh experiment at least twice a year. Attribution models drift as customer behavior and platform tracking change underneath them.
Where Paid Lens Fits Into Your Attribution Workflow
Building a reliable Markov model is one thing. Keeping it accurate, stitched, and reproducible every week is where most teams actually lose time. Paid Lens handles the operational grind sitting underneath the math: connecting your ad platforms, GA4, and CRM into one stitched dataset, flagging data quality issues before they quietly bias your transition matrix, and recalculating attribution as new conversion data lands.

Instead of manually rebuilding temp tables or rerunning scripts every time you want a fresh removal-effect read, Paid Lens surfaces ranked recommendations with confidence scores tied to that underlying data, so your team spends time acting on results instead of chasing broken pipelines or stale exports. That matters most in the exact spot this article flagged as fragile: audit trails and reproducibility. Paid Lens keeps a record of what changed and why, which is the difference between defending a budget decision and guessing at one.
If your Markov workflow currently lives in a fragile mix of scripts and spreadsheets, take a look at Paid Lens’s attribution features and see what a stitched, continuously validated version of this looks like for your account.
Sources
- Multichannel Marketing Attribution Using Markov Chains for E-Commerce – DOAJ
- ADH.TOUCHPOINT_ANALYSIS — Google Ads Data Hub
- Markov Chain Attribution Calculator | MetricGate
- dsearle90/MarkovAttribution
- SAS Help Center
FAQ
Which Attribution Model Is Best?
No single model wins outright. Markov attribution suits tactical optimization across tracked digital channels, while marketing mix modeling and controlled experiments cover strategic and offline questions Markov structurally can’t answer.
Is Google a Markov Chain?
Not directly, but Google’s PageRank algorithm, which underlies search ranking, is built on Markov chain math, and Google Ads Data Hub uses an actual Markov chains model for its native attribution function.
What Is an Example of a Markov Chain in Real Life?
Weather forecasting models, board games like Monopoly, and page-ranking algorithms all use Markov chains, alongside marketing attribution, where a customer’s next touchpoint is modeled as depending on their current channel state.
What Is Markov Analysis Used For?
Markov analysis models systems that move between states over time, and in marketing it’s used specifically to calculate removal effects, which quantify each channel’s contribution to conversions.
Do I Need a Data Team to Run Markov Attribution?
You need clean, stitched data more than a large team. Tools like the open-source MarkovAttribution package or a platform like Paid Lens that handles stitching and validation automatically can make this accessible without a dedicated data science function.