Media Mix Modeling: A Practical Guide for Marketers
Discover how media mix modeling empowers marketers to allocate budgets effectively, ensuring data-driven decisions and maximizing ROI.

Media Mix Modeling: A Practical Guide for Marketers
Media mix modeling (MMM) is a privacy-resilient, top-down statistical method that estimates each marketing channel’s contribution to revenue using aggregate time-series data. Use it when you need to allocate budgets across channels that include offline media, when user-level tracking is unavailable or restricted, or when you need defensible ROI numbers for a CFO conversation.
MMM has resurged as a measurement priority precisely because it does not depend on cookies or device identifiers. Privacy changes and signal loss are driving renewed investment in aggregate modeling, and industry guidance now recommends triangulating MMM with incrementality tests and attribution in a modern measurement stack. Open-source frameworks like Google Meridian and Meta’s Robyn have lowered the technical barrier, and platforms like Getpaidlens translate model outputs into prioritized, confidence-scored actions that marketing teams can act on the same day.
Key Takeaways
Media mix modeling is most valuable when it is embedded in a quarterly planning cadence, fed by clean aggregate data, and validated against controlled experiments.
| Point | Details |
|---|---|
| Core MMM function | Decomposes revenue into baseline and channel-driven incremental effects using adstock and saturation transforms. |
| Minimum data requirement | Two years of weekly spend and outcome data is the workable minimum; three years preferred for stable seasonality separation. |
| Validation is mandatory | Hold out the most recent 8–13 weeks and compare model predictions to known events before trusting any allocation recommendation. |
| Use a hybrid measurement stack | MMM handles strategic allocation; MTA handles in-flight digital optimization; incrementality tests validate causal claims. |
| Getpaidlens operationalizes outputs | The platform connects ad platforms and CRM data, runs validated model pipelines, and delivers confidence-scored budget recommendations. |
Table of Contents
- How media mix modeling actually works
- What data does MMM actually need?
- Which modeling approach fits your team?
- What business questions does MMM answer?
- What MMM cannot reliably do
- MMM vs. attribution vs. incrementality testing
- How to get started with MMM in 8–14 weeks
- How to choose the right MMM implementation route
- How Getpaidlens operationalizes MMM insights
- What I’d tell a marketing leader starting with MMM today
- Getpaidlens turns MMM outputs into decisions, not just reports
- Sources
How media mix modeling actually works
MMM decomposes an outcome metric, typically revenue or orders, into two parts: a baseline that would have occurred without any marketing, and an incremental lift driven by each channel’s activity. The model then attributes that lift by channel, controlling for everything else that moved the outcome.
Adstock is the mechanism that makes this realistic. When you run a TV campaign, its effect does not vanish the moment the spot airs. Viewers remember ads for days or weeks, and that memory drives purchases later. Adstock captures this carryover by applying a decay function to each channel’s spend or exposure data, so the model sees a weighted sum of current and past activity rather than just this week’s number. The decay rate differs by channel: TV and brand campaigns carry longer carryover than paid search, which tends to have near-zero lag. Getting the decay rate wrong by even a small margin can misattribute millions of dollars of revenue.
Saturation is the second transformation. Every channel has a point of diminishing returns: the first thousand impressions drive strong lift, but the ten-thousandth impression drives almost none. MMM applies a saturation function (often a Hill or Michaelis-Menten curve) to each channel’s adstocked exposure, producing a marginal return curve. That curve is what tells you whether a channel is over- or under-invested. A channel sitting on the flat part of its curve is a candidate for reallocation; one still on the steep part may deserve more budget.
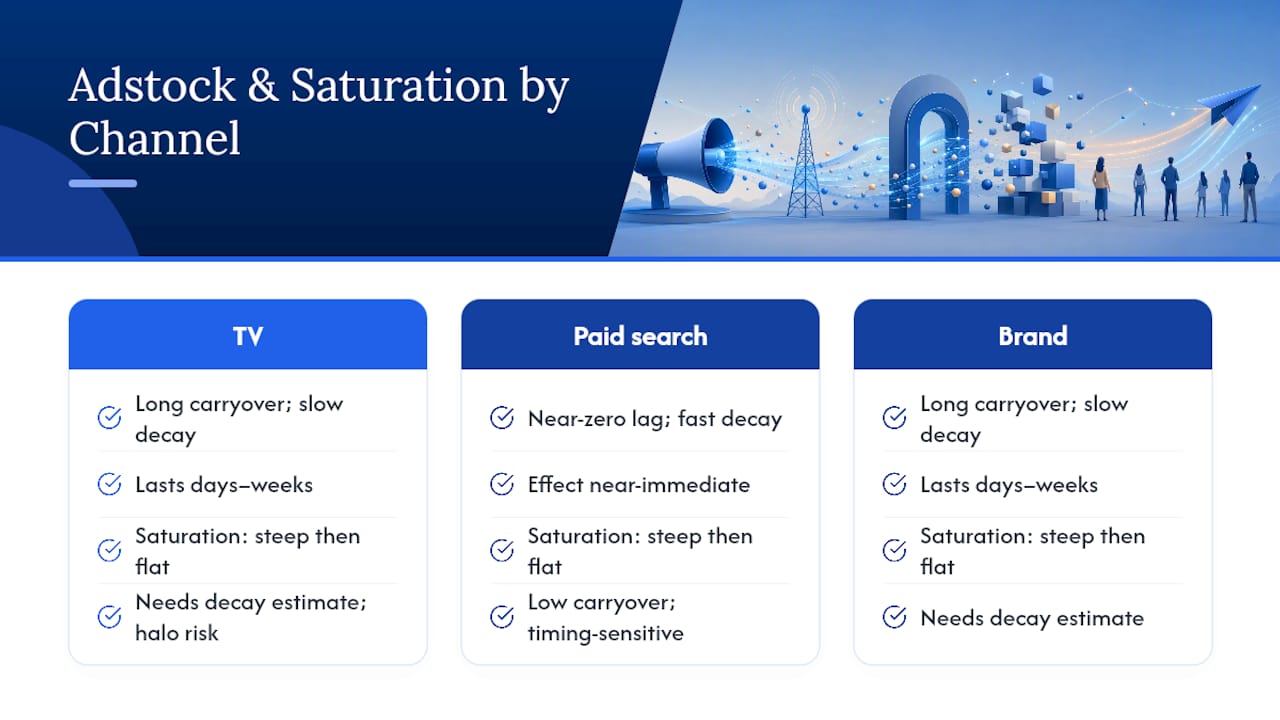
Beyond adstock and saturation, the model includes control variables to isolate what media actually caused. Standard controls include seasonality (weekly or monthly indices), price changes, promotional events, distribution expansions, and macro indicators like consumer confidence or fuel prices. Interactions matter too. TV awareness often amplifies paid search conversion rates, a halo effect that a model without interaction terms will misattribute entirely to search.
A simplified decomposition looks like this:
Sales = Baseline + Σ(Adstocked and Saturated Media Effect per Channel) + Σ(Control Variable Effects) + Error
The Think with Google CMO handbook frames this well: MMM is both art and science, and model design must embed business context, including promotion calendars and distribution changes, to produce recommendations that align with market reality rather than statistical artifacts.
What data does MMM actually need?
The most common reason a first MMM project stalls is data readiness, not modeling complexity. Before you touch a model, audit your inputs against this checklist.
| Input | Minimum granularity | Minimum history |
|---|---|---|
| Outcome metric (revenue, orders, leads) | Weekly | 2 years |
| Media spend by channel | Weekly | 2 years |
| Impressions / GRPs / reach (where available) | Weekly | Match outcome history |
| Promotions and price changes | Event-level, mapped to weeks | Full history |
| Distribution or assortment changes | Event-level, mapped to weeks | Full history |
| Seasonality indicators / holidays | Weekly | Full history |
| External macro indicators (optional) | Weekly or monthly | Full history |
Two years of weekly data is a workable minimum for a defensible model; three years is preferred when you need stable seasonality separation. One year is an absolute floor, and at that length you risk confounding seasonal patterns with media effects, which makes channel attribution unreliable.
The most common data quality problems are:
- Inconsistent UTM naming across campaigns, which causes spend to aggregate under wrong channel labels
- Missing spend periods when a platform export omits paused campaigns or brand safety holds
- Misaligned time zones or granularity between ad platforms and the outcome data warehouse
- Double-counting when the same impression appears in both a DSP export and a publisher direct report
- Flat spend history with no meaningful variation across channels, which leaves the model unable to separate effects
Remediation is straightforward in principle. Standardize your UTM taxonomy before pulling historical data. Merge platform exports with a validation step that flags gaps and totals against invoices. Build a promotions calendar that maps every discount, product launch, and distribution event to the week it occurred. If your spend history lacks variation, plan a small-scale geo test or channel-pause experiment to generate signal before modeling.
Pro Tip: Create a “data contract” document that specifies the exact field names, time zones, and aggregation rules for every data source feeding the model. Revisiting this contract at each quarterly refresh prevents the silent data drift that corrupts model comparability over time.
Which modeling approach fits your team?
Harvard Business Review describes MMM as a long-standing statistical method where validation and interpretation are the primary challenges, not algorithm availability. That framing holds: the choice of modeling approach matters less than the rigor of your validation process.
Ordinary least squares (frequentist regression)
The simplest approach. Fast to run, easy to explain to stakeholders, and requires no specialized statistical software beyond R or Python. The downside is that it produces point estimates with no uncertainty range, which makes it easy to overstate confidence in channel ROI figures. It also struggles with multicollinearity when channels move together, which is common in practice.
Bayesian MMM
The current industry standard for teams that need defensible uncertainty quantification. Bayesian models produce credible intervals around each channel’s ROI estimate rather than a single number, which is far more honest and useful for budget decisions. They also accept experiment results as priors, meaning a geo lift test you ran last quarter can directly inform the model’s channel effect estimates. The trade-off is computational cost and a steeper learning curve. Stan, PyMC, and Google Meridian all support Bayesian MMM workflows.
Hierarchical models
Used when you have multiple markets, brands, or product lines. A hierarchical structure pools information across units while still estimating unit-specific effects, which reduces overfitting in markets with thin data. Relevant for national advertisers running regional campaigns or agencies managing multi-brand portfolios.
Regularization (Lasso and Ridge regression)
A practical middle ground when you have many channels and limited data. Lasso shrinks small coefficients toward zero, effectively selecting the channels with real signal. Ridge keeps all channels but shrinks coefficients proportionally. Both reduce overfitting without the full complexity of a Bayesian setup.
Validation is non-negotiable regardless of approach. A model that fits historical data well but fails on a holdout period is not a model you should trust with next quarter’s budget. Standard validation steps:
- Hold out the most recent 8–13 weeks and check whether the model’s predictions match actual outcomes
- Backcast to known events (a major promotion, a product launch) and verify the model captures the spike
- Compare model-implied channel ROI to results from any controlled experiments you have run
- For Bayesian models, inspect credible intervals: a channel whose 90% credible interval spans zero to 5x ROI is not a channel you should confidently reallocate toward
Read channel ROI as a range, not a point. A model that says $2.10 with no interval is hiding uncertainty that will eventually show up as a bad allocation decision.
What business questions does MMM answer?
MMM is most useful for decisions made at the planning level, not the campaign level. The high-value use cases:
- Cross-channel budget allocation: Which channels are over-invested relative to their marginal return? Where does an additional dollar produce the most incremental revenue?
- Cannibalization and halo detection: Does your TV spend lifting paid search conversion rates? Is one product line cannibalizing another’s media-driven sales?
- Forecasting and scenario simulation: If you cut linear TV by 20% and reinvest in connected TV and paid social, what does the model predict for revenue over the next two quarters?
- Long- vs. short-term ROI decomposition: Some channels (brand, TV) build baseline over time; others (paid search, promotions) drive immediate conversion. MMM can separate these effects.
- CFO and CPO reporting: Translate media investment into revenue contribution with confidence ranges that finance teams can audit.
A realistic example: a retailer’s model shows that TV has reached saturation (marginal ROI below $0.80) while paid social is still on the steep part of its return curve. That recommendation goes to the CFO with a confidence interval, not just a point estimate.
MMM tells you where to allocate. It does not tell you why a channel is underperforming at the creative or audience level, and it does not prove causation. Decisions about which specific campaigns to pause or which creatives to scale require follow-up incrementality tests or platform-level attribution data.
What MMM cannot reliably do
MMM is a powerful planning tool with real limits. Knowing them prevents the most expensive mistakes.
- Correlation vs. causation: MMM identifies statistical associations between spend and outcomes. A channel that always runs during your strongest seasonal periods will look more effective than it is unless the model controls for seasonality perfectly.
- No campaign or creative granularity: The model works at the channel level. It cannot tell you whether your top-of-funnel video creative outperformed your retargeting creative.
- Sensitivity to flat spend: If a channel’s spend barely changed over the modeling period, the model cannot reliably estimate its effect. The coefficient will be noisy and the confidence interval wide.
- Structural breaks: A major product launch, a distribution expansion, or a competitor’s exit from the market can shift the baseline permanently. Models trained on pre-break data will misattribute the structural shift to whatever media was running at the time.
- Measurement bias from poor controls: Missing a major promotion from the controls list will inflate the media coefficient for whatever channel ran heaviest during that promotion.
Mitigation strategies that actually work: run at least one geo lift or holdout experiment per major channel per year and feed those results into your Bayesian model as priors. Use nested models that connect brand health metrics (awareness, consideration) to sales, so the model can separate brand-building effects from direct response. Build a governance process that requires a documented review of model assumptions and data inputs before any budget recommendation goes to finance.
Pro Tip: Maintain versioned snapshots of both the model and the underlying data at each quarterly refresh. When a model recommendation is questioned six months later, you need to be able to reproduce exactly what the model saw and why it recommended what it did. This audit trail is also what separates a defensible MMM program from a black box.
MMM vs. attribution vs. incrementality testing
Each measurement method answers a distinct question. Choosing one over the others is usually the wrong move; the right answer is a hybrid stack where each method does what it does best.
| Dimension | MMM | Multi-touch attribution (MTA) | Incrementality testing |
|---|---|---|---|
| Granularity | Channel / aggregate | User / touchpoint | Campaign or geo level |
| Causality | Correlational with controls | Correlational | Causal |
| Offline coverage | Yes | No | Partial (geo tests) |
| Privacy resilience | High (no user data) | Low (requires user IDs) | Medium |
| Typical cadence | Quarterly | Daily / weekly | Per experiment (4–8 weeks) |
| Primary decision use | Strategic budget allocation | Tactical in-flight optimization | Causal validation |
Search Engine Land’s comparison of MTA and MMM makes the complementary case clearly: MTA provides near-real-time, user-level signals for tactical optimization while MMM offers strategic, aggregate-level budget guidance. Neither replaces the other.
A recommended hybrid workflow:
- Use MMM for quarterly budget planning and annual channel mix decisions
- Use MTA for in-flight optimization of digital campaigns where user-level data is available and consented
- Use incrementality tests (geo holdouts, conversion lift studies) to validate causal claims and provide priors for Bayesian MMM
Triangulating results is the discipline that separates mature measurement programs from single-method shops. When your MMM says paid social ROI is $2.40 and your most recent geo lift test shows $1.90, that gap is a signal worth investigating, not a reason to distrust one method entirely.
How to get started with MMM in 8–14 weeks
The range in that timeline is real. Teams with clean, centralized data and a data scientist on staff can reach a first model in eight weeks. Teams that need to rebuild their data pipeline from scratch, or that are starting with a single year of history, should plan for fourteen weeks before the first defensible output.
-
Data inventory and cleanup (weeks 1–3). Pull all outcome and spend data. Audit against the checklist above. Resolve UTM inconsistencies, fill spend gaps, and build the promotions calendar. This step almost always takes longer than planned.
-
Select your approach and tool (week 3–4). Decide between open-source (Robyn, Meridian), an agency-managed program, or a SaaS platform. Match the choice to your team’s statistical capacity and your timeline for ongoing refreshes.
-
Run a pilot model (weeks 4–7). Start with your top three or four channels and two years of data. Fit the model, inspect coefficients, and check whether the decomposition passes a sanity check against known business events.
-
Validate with holdouts and experiments (weeks 7–9). Hold out the most recent quarter and check prediction accuracy. Compare model-implied ROI to any experiment results you have. Adjust priors or controls where the model diverges from known ground truth.
-
Translate outputs to allocation recommendations (weeks 9–11). Convert channel ROI curves into a budget reallocation scenario. Quantify the predicted revenue impact and attach confidence intervals. Prepare a one-page summary for the marketing leader and finance partner.
-
Operationalize into planning cadence (weeks 11–14 and ongoing). Schedule quarterly model refreshes tied to the budget planning cycle. Assign ownership for data updates, model runs, and stakeholder reviews.
Roles you need: a marketing analyst or data scientist to build and maintain the model; a data engineer to own the pipeline; a marketing leader or finance partner as the stakeholder sponsor who can act on recommendations; and optionally an agency or SaaS vendor for the first build if internal capacity is limited.
Quick wins to prioritize early: standardize your channel taxonomy before the first model run, produce a channel-contribution dashboard from the pilot model output, and run one small-scale geo test to validate at least one channel’s modeled ROI before the first budget recommendation goes to leadership.
How to choose the right MMM implementation route
Four routes exist, each with a different cost-capability trade-off.
Open-source frameworks (Robyn, Meridian). Meta’s Robyn and Google’s Meridian are both free, well-documented, and actively maintained. Robyn runs in R; Meridian runs in Python with a TensorFlow Probability backend. Both support Bayesian estimation, adstock and saturation transforms, and experiment integration. The trade-off is that you need a data scientist comfortable with the framework, a data engineer to maintain the pipeline, and internal processes for versioning and governance. For teams with that capacity, open-source is the highest-control, lowest-cost path.
In-house statistical builds. Some teams build custom models in Stan, PyMC, or scikit-learn rather than adopting a framework. This gives maximum flexibility but requires the most expertise and the longest build time. Reproducibility and documentation discipline are critical here; custom builds become unmaintainable quickly without them.
Agency-managed programs. Measurement agencies and media consultancies offer managed MMM as a service, typically on a quarterly or annual retainer. The advantage is speed and expertise; the disadvantage is limited transparency into model assumptions and difficulty integrating outputs into your own planning tools. Ask any agency vendor for reproducible code, documented priors, and the ability to export scenario simulation outputs.

SaaS decision-intelligence platforms. Platforms in this category connect directly to your ad platforms and data sources, run model pipelines with documented assumptions, and surface outputs as prioritized recommendations with confidence scores. The value proposition is faster time-to-insight and lower data engineering overhead, at the cost of less modeling flexibility than a fully custom build.
Selection criteria to apply regardless of route:
- Does the tool accept experiment results as model priors?
- Does it produce confidence intervals or credible intervals, not just point estimates?
- Can it run scenario simulations and export results in a format your finance team can audit?
- Does it handle U.S. privacy constraints? For teams with California-based customers, CCPA compliance requires that any user-level data feeding the model is handled under appropriate consent frameworks. MMM’s aggregate nature means it is generally lower-risk than MTA, but data pipelines that pull from CRM or loyalty systems still need legal review. Cross-border data flows involving EU customer data also require GDPR-compliant transfer mechanisms.
- Is the pipeline reproducible? Can you re-run last quarter’s model on last quarter’s data and get the same output?
How Getpaidlens operationalizes MMM insights
Running a statistically sound MMM is one problem. Turning its outputs into decisions your team acts on before the next budget cycle is a different problem, and it is where most programs stall.
Getpaidlens is built for the second problem. The platform connects directly to your ad platforms, analytics tools, and CRM data, validates data quality at ingestion, and standardizes metric schemas across sources so the model always sees clean, comparable inputs. From there, it runs automated model refresh pipelines and surfaces results as a ranked queue of recommendations, each scored by expected revenue impact and confidence level.
What that looks like in practice:
- A ranked list of budget reallocation suggestions, each showing predicted revenue impact and a confidence interval so your team knows which recommendations are high-conviction and which need more data
- A prioritized set of campaign-level actions tied to model outputs, so analysts are not left translating a coefficient table into a to-do list
- Executive-ready exports that connect channel contribution estimates to revenue, formatted for CFO and finance reviews
Governance is built in. Getpaidlens maintains versioned data snapshots and an audit trail of model changes, so when a recommendation is questioned three months later, the answer is reproducible. Explainability features show which inputs drove each recommendation, which is what separates a trustworthy model program from a black box that finance will eventually stop believing.
Getpaidlens is particularly well-suited for performance marketing teams that lack dedicated data engineering bandwidth, need fast time-to-insight, or manage multiple client accounts that each require their own model refresh and reporting cadence. The platform’s confidence scoring means teams can prioritize the highest-impact actions first rather than treating every model output as equally actionable.
When to pick an integrated platform over open-source: if your team does not have a data scientist who can maintain a Robyn or Meridian pipeline on an ongoing basis, or if you need client-ready reporting on a weekly cadence, a SaaS platform will consistently outperform a custom build that gets refreshed only when someone has bandwidth.
Core capabilities that translate directly to business outcomes:
- Data integration and validation: connects multiple ad platforms and flags quality issues before they corrupt model inputs
- Standardized metric schemas: eliminates the manual reconciliation that consumes analyst time before every model run
- Confidence-scored recommendations: surfaces which budget moves are high-conviction and which carry more uncertainty
- Audit trails and versioning: makes model outputs defensible to finance and reproducible across quarters
What I’d tell a marketing leader starting with MMM today
Three recommendations, in priority order.
Fix your data before you touch a model. A sophisticated Bayesian MMM built on inconsistent UTM data and a missing promotions calendar will produce confident-looking wrong answers. Spend the first month on taxonomy standardization and data validation. It is unglamorous work, and it is the work that determines whether the model is useful or decorative.
Run at least one experiment per major channel per year. MMM tells you where correlations point; experiments tell you what actually caused what. The two methods are most powerful when experiment results feed directly into model priors, tightening the credible intervals on your highest-stakes channel decisions. Teams that skip experiments end up with models that look precise but cannot be validated, which means finance will eventually stop trusting them.
Integrate MMM into your quarterly planning cadence from the start, not as an afterthought. The organizational benefit of MMM is not the model itself; it is the shared language it creates between marketing and finance. When both teams are looking at the same channel contribution estimates with documented confidence ranges, budget conversations shift from opinion-based to evidence-based. That shift is what produces better CFO alignment and clearer ROI narratives over time.
Getpaidlens turns MMM outputs into decisions, not just reports
Most teams that invest in MMM spend more time maintaining the model than acting on it. Getpaidlens closes that gap by connecting your ad platforms and revenue data, running validated model pipelines, and delivering a ranked list of budget and campaign recommendations with confidence scores attached.
The platform’s attribution and decision-intelligence features are built specifically for performance marketing teams that need to move from model output to budget decision in days, not weeks. You get prioritized recommendations tied to expected revenue impact, executive-ready exports for finance reviews, and an audit trail that makes every recommendation reproducible.
See how Getpaidlens operationalizes your measurement stack at Getpaidlens.