Four Steps to Trustworthy Cross Channel Reporting for Practitioners
Four steps to dashboard first cross channel reporting: normalize revenue by day, freeze definitions, and add operational QA.

Four Steps to Trustworthy Cross Channel Reporting for Practitioners
Cross-channel reporting is the practice of pulling performance data from every marketing platform, analytics tool, and revenue source into one connected view so you can compare channels on equal terms. The fastest way to get value from it: pick one system as your single source of truth, freeze how you define each metric, and put a blended KPI strip at the top of your dashboard before you touch anything else. The steps that make that possible follow below.
TL;DR:
- Cross-channel reporting requires pulling data from four core sources: ad platforms, analytics, CRM, and payment systems, to accurately measure the full customer journey.
- Normalizing data involves currency conversion at transaction time and standardizing conversion definitions across platforms to ensure consistency.
- Blended metrics like ROAS and CAC should be calculated across all channels using one currency and clear attribution models, with attribution and deduplication crucial for accuracy.
- Establishing governance through naming conventions, connection audits, frozen definitions, and change logs prevents data decay and maintains report trustworthiness.
- Validating data quality early with automated tools like GetPaidLens reduces maintenance time and prevents misleading performance insights.
Table of Contents
- What Is Cross-Channel Reporting, Really?
- Why Cross-Channel Reporting Actually Moves the Needle
- A 4-Step Framework for Building Cross-Channel Reporting
- Key Metrics and How to Present Them
- Attribution, Deduplication, and Normalization Choices
- Governance and the Operational Checklist That Keeps It Trustworthy
- Where an Audited Decision Layer Fits Into This Framework
- What I’ve Learned Watching Teams Build These Systems
- Get a Reporting System That Validates Itself Before You See It
- Sources
- FAQ
What Is Cross-Channel Reporting, Really?
Cross-channel reporting connects data across separate marketing channels, ad accounts, and CRM records into one measurement system that treats them as parts of a single customer journey. It’s different from cross-platform analysis, which usually means comparing the same channel across devices (mobile vs. desktop Facebook, for example), and from omnichannel reporting, which extends the same logic to offline touchpoints like retail visits and call centers. Google’s Analytics documentation frames this as connecting paid advertising, organic activity, and site or app behavior to the conversions that matter across all of them.
A working system pulls from four core sources:
- Advertising platforms (Google Ads, Meta, LinkedIn, TikTok)
- Web and app analytics (GA4 or equivalent)
- CRM and sales data (deal stages, closed revenue)
- Payment and billing systems (actual transaction values, refunds, currency)
Miss any one of those, and your “cross-channel” report is really just a cross-platform ad summary wearing a bigger label.
Why Cross-Channel Reporting Actually Moves the Needle
Siloed reports lie by omission. Each platform reports its own conversions with its own attribution window, so the same purchase can get counted by Google Ads, Meta, and your CRM simultaneously. Add those numbers up across dashboards and you’re not measuring performance. You’re measuring how many systems touched the same customer.
A trusted, deduplicated report changes what you can act on. Instead of debating whose numbers are “right” in a Monday meeting, a team working from one normalized dataset can reallocate budget the same day and run experiments with a clean baseline to measure against. Dynata’s work on cross-channel measurement identifies identity resolution and deduplication as the core technical tasks that make this possible, not an optional refinement. Without them, every reach or ROAS number you report is inflated by an unknown margin. Listrak’s analysis of cross-channel analytics makes a similar point for ecommerce teams specifically: centralized reporting is what turns scattered numbers into insight you can find quickly, not just data you can look at.
A 4-Step Framework for Building Cross-Channel Reporting
You don’t need a data engineering team to build a working system. You need a sequence, and most teams skip steps because they jump straight to the dashboard.
- Define your KPIs first. Pick a north-star metric (usually blended revenue or blended ROAS) and one or two supporting metrics like blended CAC. Decide these before connecting a single data source, because the metrics you choose determine which fields you actually need.
- Map and connect your sources. Use official platform APIs and OAuth connections rather than scraped exports or manual CSV pulls. Matomo’s implementation guide walks through the data collection and cleaning steps this requires, and Statspresso’s framework breaks the source-mapping stage into its own discrete step for exactly this reason: connection quality determines everything downstream.
- Normalize before you visualize. Convert currency at the day-of-transaction rate, not a static monthly rate, and align conversion definitions across platforms so a “conversion” in Google Ads means the same thing as a “conversion” in your CRM. Timestamp alignment matters here too. A campaign that “started” in one system’s timezone can look like it started a day later in another.
- Build the dashboard in a fixed order. Wevion’s dashboard guide recommends leading with a blended KPI strip, following it with a like-for-like comparison matrix, and adding a channel-mix view last. That order isn’t arbitrary. Executives scan the strip first, analysts drill into the matrix second, and the mix view only matters once you already trust the numbers above it.
Pro Tip: Build your normalization rules into a written document before you build a single chart. Teams that skip this step end up rebuilding dashboards every time someone asks “why does this number look different from last quarter,” because nobody wrote down what changed.
Set up correctly, this framework takes a few weeks for a mid-size team with two or three ad platforms. It takes considerably longer if you’re stitching together six platforms and a legacy CRM with inconsistent field names, which is exactly why the connection step deserves more time than most teams give it.
Key Metrics and How to Present Them
Blended ROAS and blended CAC are the two numbers that matter most once your data is normalized, and both require the same underlying discipline: revenue and spend pooled across every channel, using one currency conversion standard and one conversion definition. Calculate blended ROAS as total attributed revenue divided by total spend across all channels, and blended CAC as total spend divided by total new customers acquired, not per-platform customers.
For weekly team reviews, prioritize leading indicators: cost per lead, click-through rate, and channel-mix shifts that show where budget is actually flowing. For executive reviews, lagging indicators carry more weight: blended ROAS, revenue by channel, and LTV to CAC ratio tell a cleaner story about whether spend is generating durable growth.
Present these two audiences differently:
- Executive view: a blended KPI strip up top, three to five numbers, no channel breakdown
- Analyst view: a full comparison matrix showing each channel’s contribution to the same metrics
- Strategic view: a channel-mix chart that often reveals budget concentrated in a channel that stopped performing months ago, a pattern that’s invisible when you look at platforms one at a time
Attribution, Deduplication, and Normalization Choices
Attribution model choice changes what your reports say happened, sometimes dramatically. Last-touch attribution is simple and fast but overcredits bottom-funnel channels like branded search. Position-based models split credit between first and last interaction, which works reasonably well for longer sales cycles. Multi-touch and algorithmic models distribute credit based on actual influence patterns in the data, and they tend to be more accurate for businesses with five or more touchpoints before conversion, though they need enough conversion volume to be statistically meaningful. StackAdapt’s guide to cross-channel attribution covers these trade-offs in more depth for teams deciding between them.
Deduplication matters just as much as the attribution model itself. Without a unified event layer, the same conversion gets counted by multiple platforms and every ROAS figure downstream is inflated.
- Use day-of-transaction currency conversion, not a monthly average rate
- Freeze reporting definitions once set, and annotate any change with a date
Pro Tip: When you change an attribution model or a conversion definition, don’t just update the dashboard. Annotate the exact date on every chart that spans the change, or you’ll spend the next quarter explaining a “drop” in performance that’s actually just a math difference.
Governance and the Operational Checklist That Keeps It Trustworthy
Reporting systems decay quietly. A campaign gets renamed, a UTM parameter gets typo’d, a token expires without anyone noticing, and three weeks later your channel-mix numbers are wrong and nobody knows why. Governance is what prevents that.
Start with a documented campaign naming convention and enforce UTM discipline across every platform your team touches. Run routine QA on your connections, not just when something looks off.
- Audit every source connection monthly for authentication errors
- Refresh tokens before they expire, not after a report breaks
- Check last-synced timestamps as part of your weekly review, not as an afterthought
- Freeze reporting definitions once agreed, and log any change with a date
| Governance Element | What It Prevents |
|---|---|
| Naming convention | Fragmented, unmatched campaign data across platforms |
| Token/connection audits | Silent sync failures that go unnoticed for weeks |
| Frozen definitions with change logs | Misleading period-over-period comparisons |
| Last-synced indicators on dashboard | Decisions made on stale data without anyone realizing |
Where an Audited Decision Layer Fits Into This Framework
Everything above is buildable by hand with a spreadsheet or a BI tool, and plenty of teams do exactly that. The maintenance burden is what catches up with you: platforms change field names, attribution windows shift, and a hand-built model quietly drifts out of sync unless someone owns it full-time.
Getpaidlens approaches this by connecting ad platforms directly and validating data quality before it reaches a dashboard, rather than after a report already looks wrong.
- It transforms raw platform data into a ranked queue of recommended actions, weighted by expected impact
- It flags data quality issues automatically instead of waiting for a stakeholder to spot a discrepancy
- It supports client-ready reporting and export for teams that need to hand a clean view to executives or clients without rebuilding it by hand
What I’ve Learned Watching Teams Build These Systems
The teams that struggle aren’t missing data. They’re missing agreement. Two analysts using different attribution windows will produce two “correct” numbers that contradict each other, and that gap erodes trust in the whole system faster than any missing connector does.
The fix isn’t more sophisticated math. It’s freezing your definitions before you scale the dashboard, and making the last-synced timestamp as visible as the revenue number next to it. That one habit prevents more bad budget decisions than any attribution model swap ever will.
— Shraddha
Get a Reporting System That Validates Itself Before You See It
Everything in this framework, connecting sources properly, normalizing currency and definitions, building a blended KPI strip, checking sync health, is work someone on your team has to own manually if you build it with spreadsheets or a general-purpose BI tool. Getpaidlens does that validation work upstream, so the dashboard you open already reflects data that’s been checked, not data you have to check yourself.
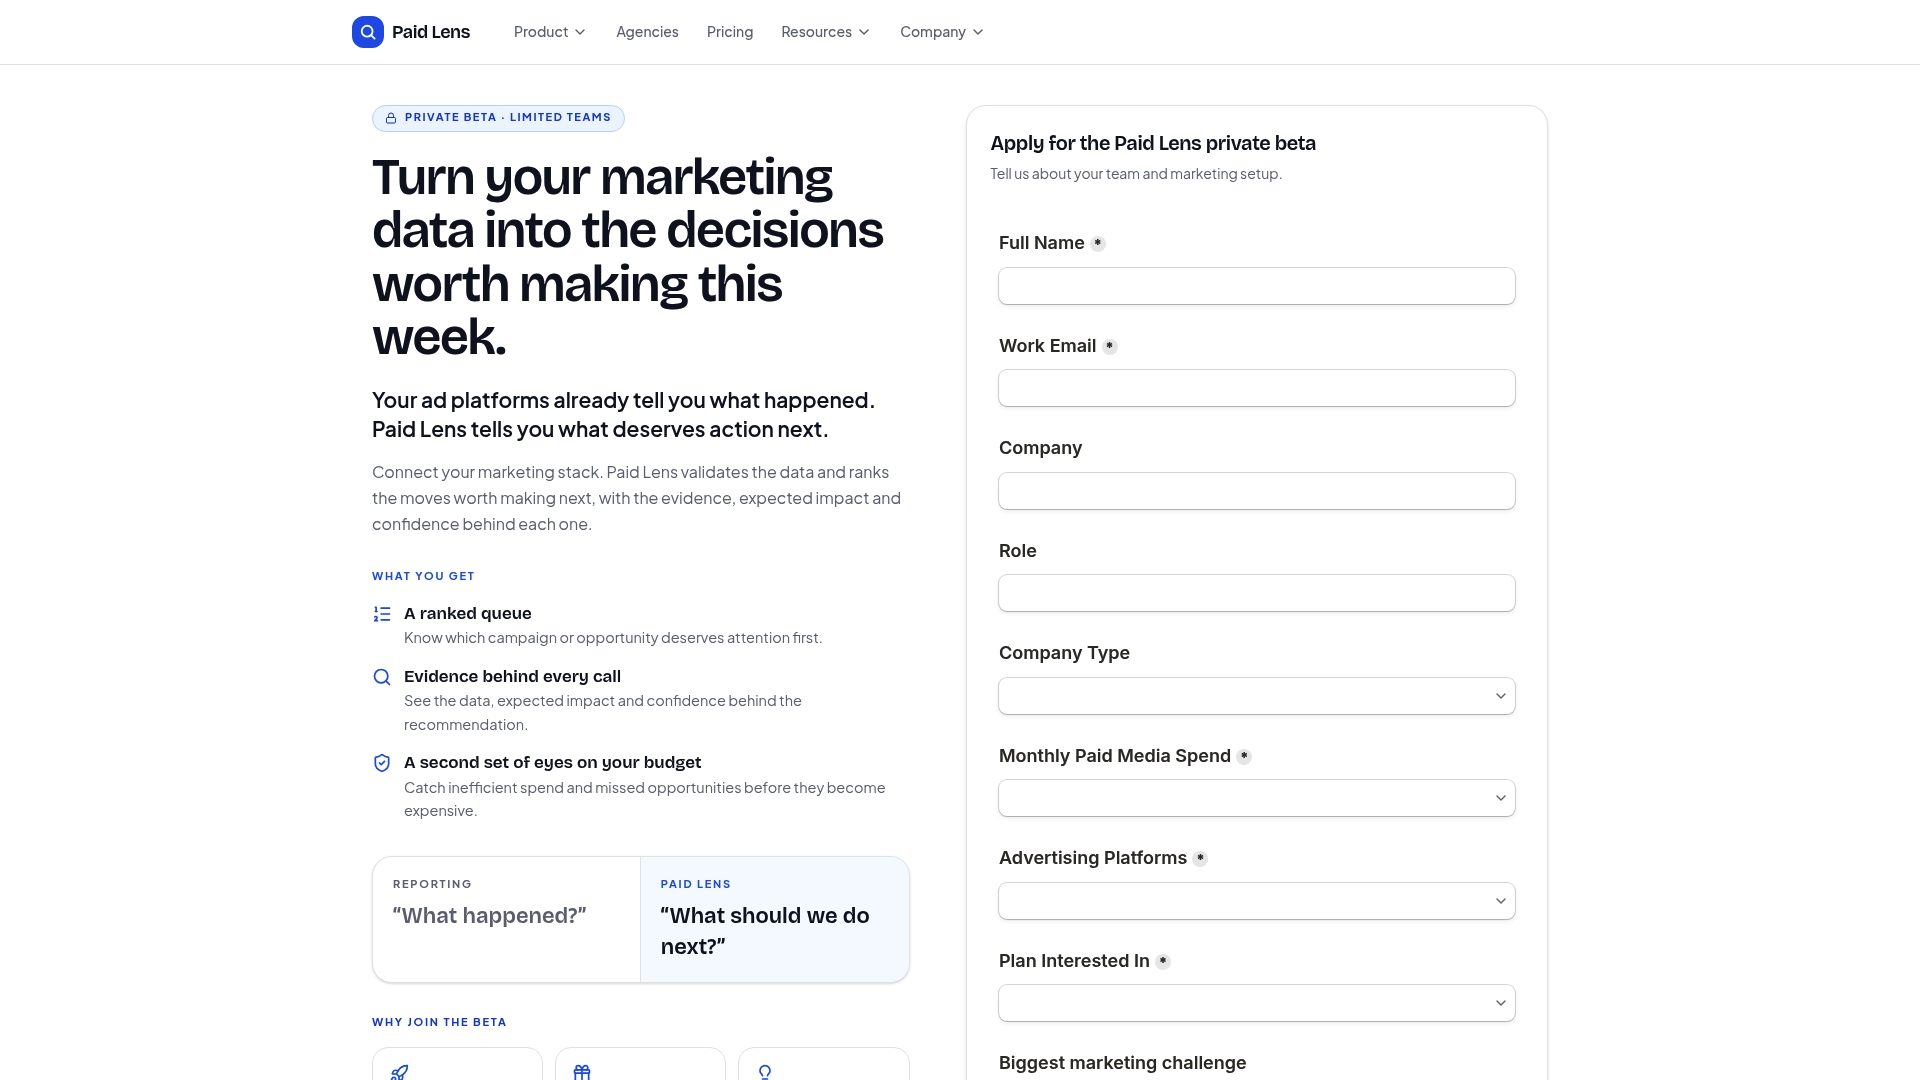
It connects to your ad platforms and CRM through official APIs, validates data quality automatically, and turns the result into a ranked queue of recommendations instead of a raw table you have to interpret. When you need to hand a clean report to leadership or a client, the Excel export feature gets you there without a rebuild. If your current reporting setup takes more time to maintain than it does to read, request a walkthrough and see how much of that maintenance disappears.
Sources
Which sources you connect, and how, determines whether your reporting stays accurate six months from now. Ad platforms are the obvious starting point: Google Ads, Meta, TikTok, and LinkedIn each expose official APIs that pull spend, impressions, and platform-reported conversions with far more reliability than a manual export.
Analytics and CRM sources come next. GA4 (ideally paired with server-side tracking for accuracy) covers on-site behavior, while HubSpot or Salesforce supplies the deal-stage and closed-revenue data that ties marketing activity to actual pipeline. Cometly’s guide to multi-channel intelligence makes the case for server-side identity stitching specifically because client-side tracking loses an increasing share of events to browser restrictions and ad blockers.
Payments and revenue systems close the loop, especially for ecommerce and subscription businesses where the “conversion” recorded by an ad platform and the actual revenue collected can diverge.
Whatever you connect, build in operational visibility:
- Cross-channel conversion reporting in Analytics
- How to Implement Cross-Channel Analytics: A Guide for Marketers - Matomo
- Cross-Channel Reporting: The Complete 2026 Guide | Statspresso
- What Is Cross-Channel Measurement? How It Works and Why It Matters
FAQ
Can You Give an Example of Cross-Channel Marketing?
A customer who clicks a Meta ad, later searches your brand on Google, and finally converts through an email campaign has completed a cross-channel journey. Cross-channel reporting is what connects those three touchpoints into one record instead of three disconnected conversions.
What Is Cross-Channel, Exactly?
Cross-channel refers to marketing activity and measurement that spans multiple platforms or mediums, such as paid search, social ads, and email, treated as one connected system rather than isolated campaigns.
What’s the Difference Between Cross-Channel and Omnichannel?
Cross-channel focuses on connecting digital marketing channels and their data into one reporting view, while omnichannel extends that same connected experience to offline touchpoints like in-store visits and phone sales.
What Is Cross-Channel Communication?
Cross-channel communication means delivering a consistent message to a customer across multiple platforms, whether email, social, or ads, so the experience feels connected rather than repetitive or contradictory. In reporting terms, it’s the customer-facing counterpart to the data-side work of cross-channel reporting.